Showing posts with label technical analysis. Show all posts

Sunday, July 11, 2010

Why We Are Shorting The S&P Like Crazy - Thanks to This "Mini-Rally" Gift!

Here's your weekly investing outlook from CommodityBullMarket.com - and even though commodities are likely to run into some serious headwinds in the short term, we're still firing away with some contrarian investing and trading ideas!

If you're not yet subscribed to our new (and free) daily newsletter, The Contrary Investing Report, you can request a free subscription here

I'd highly recommend this, because we post articles and news throughout the trading day!  All this and more on our new site: http://www.contraryinvesting.com/
 
Now for the week's lead story...

Why We're Short the S&P - Again - Thanks to This Mini-Rally!

Two weeks ago, we picked up a story courtesy of Bespoke Investments that showed just 4% of S&P 500 stocks were above their 50-day moving average - a level not even seen during the March 2009 lows!
So we thought a stock market bounce might be on tap - and sure enough, this week we got it.

Now after 4 straight up days, where do we sit?  We're now out of extreme territory - now with 29% of S&P 500 stocks above their 50-day MA.  To illustrate the relationship between this ratio, and the actual price of the S&P 500, I plotted both below for the year to date:

S&P Stocks Above 50 Day Moving Average
S&P 500 Price Chart July 8 2010

Of course this is a crude technical indicator, and one based on trailing prices at that.  But it has been effective at identifying extremes - especially oversold ones.  Not as much during overbought situations (like February to April of this year).

So where to from here?  I still see this ship heading down (here's the big picture of "why").

But we could rally further from here.  We closed Friday at 1077 on the S&P.  A rally up to but not surpassing the June highs around the 1130 mark would keep our bear market signature of lower highs and lower lows intact.

But I don't think a run up to 1130 is likely.  We've retraced roughly 50% of the last decline at this point.  So we could go farther - but that is not required at this point.  We're already halfway there - this mini-rally is livin' on a prayer!

Bottom line: Any further price appreciation will certainly leave a bear like me licking his lips for a chance to reinitiate a nice, juicy short position!  So, we initiated a short position on Friday.

And if you're new to our "shorting the S&P 500" mini-series, you can get caught up on our trade history - and thought process behind the trades - in the Shorting the S&P 500 section on our blog. 


More Investing News...
 
Stock, real estate, precious metals OK...just stay clear of bonds!

More than forecast - would you believe it?

Look out below, global economy! 

The public fiscal train is hurdling out of control

Thursday, May 27, 2010

When Should You Short the S&P 500? Some Recommended Price Targets

And when I say short term, I mean VERY short term!

We're in the midst of an overdue rally that was needed to relive this oversold condition...nothing strange at all about it.  Question is, how high can it go?

We explored this on our sister site ContraryInvesting.com, in an effort to figure out when it will be safe to short the S&P 500 again:
I did a quick back-of-the-envelope calculation – because markets are probabilistic, after all – to see where this retracement may end. For my calculations, I’m saying that this decline began at 1173 on the S&P, and ended at the intra-day low of 1040:
The magical retracement range you always hear about is approximately 38-62% of the previous move. This would put us somewhere in between 1091 and 1123.

Source: StockCharts.com 
We hit an intra-day high today of 1098, and we sit just a point below this as I type. So the next turn down could complete this move.
Let’s sit back and see what tomorrow’s trading brings. If we do indeed get a rally towards the top end of my 1091-1123 range – or better yet, all the way up to Clark’s 1130 target, we’ll be looking to re-initiate our short position, for what we anticipate could be a doozy of a next leg down.
Interested in shorting the S&P 500 too?  Here's our thought process and recommendations:

Monday, May 10, 2010

Why Robert Prechter Sees a Major Market Top Right Here

Spent part of my weekend reading Bob Prechter's latest newsletter, which is always thought provoking.  The folks on his team were kind enough to allow us to republish this article from the April issue of Bob's Elliott Wave Theorist.

In terms of technical and sentiment analysis, I think Prechter is second to none.  He's been bearish for some time no doubt - it looks like his previous warnings and premonitions are coming to roost now.

What Do These 8 Technical Indicators Mean for the Markets?
May 10, 2010

Editor's Note:    The following article is excerpted from Robert Prechter's April 2010 issue of the Elliott Wave Theorist. For a limited time, you can visit Elliott Wave International to download the full 10-page issue, free.

By Robert Prechter, CMT

Technical Indicators

It is rare to have technical indicators all lined up on one side of the ledger. They were lined up this way—on the bullish side—in late February-early March of 2009. Today they are just as aligned but on the bearish side. Consider this short list:
  1. The latest report shows only 3.5% cash on average in mutual funds. This figure matches the all-time low, which occurred in July 2007, the month when the Dow Industrials-plus-Transports combination made its all-time high. But wait. The latest report pertains only through February. In March, the market rose virtually every day, so there is little doubt that the percentage of cash in mutual funds is now at an all-time low, lower than in 2000, lower than in 2007! We will know for sure when the next report comes out in early May. Regardless, the confidence that mutual fund managers and investors express today for a continuation of the uptrend rivals their optimism of 2000 and 2007, times of the two most extreme expressions of stock-market optimism ever.
  2. The 10-day moving average of the CBOE Equity Put/Call Ratio has fallen to 0.45, which means that the volume of trading in calls has been more than twice that in puts. So, investors are interested primarily in betting on further rising prices, not falling prices, and that’s bearish. The current reading is less than half the level it was thirteen months ago and its lowest level since the all-time peak of stock market optimism from January 1999 to September 2000, the month that the NYSE Composite Index made its orthodox top. The 30-day average stands at 0.50, the lowest reading since October 2000. It took years of relentless rise following the 1987 crash for investors to get that bullish. This time, it’s taken only 13 months.
  3. The VIX, a measure of volatility based on options premiums, has been sitting at its lowest level since May 2008, when wave (2) of ((1)) peaked out and led to a Dow loss of 50% over the next ten months. Low premiums indicate complacency among options writers. The quants who designed the trading systems that blew up in 2008 generally assumed that low volatility meant that the market was safe, so at such times they would advise hedge funds to raise their leverage multiples. But low volatility is actually the opposite, a warning that things are about to change. The fact that the options market gets things backward is a boon to speculators. Whenever options writers are selling options cheap, the market is likely to move in a big way. Combined with the readings on the Equity Put/Call Ratio, puts right now are a bargain.
  4. In October 2008 at the bottom of wave 3 of (3) of ((1)), the Investors Intelligence poll of advisors (which has categories of bullish, bearish and neutral), reported that more than half of advisors were bearish. In December 2009, it reported only 15.6% bears. This reading was the lowest percentage since April 1987, 23 years ago! As happens going into every market top, the ratio has moderated a bit, to 18.9% bears. In 1987, the market also rallied four months past the extreme in advisor sentiment. Then it crashed. The bull/bear ratio in October 2008 was 0.4. In the past five months, it has been as high as 3.4.
  5. The Daily Sentiment Index, a poll conducted by Trade-Futures.com, reports the percentage of traders who are bullish on the S&P. The reading has been registering highs in the 86-92% range ever since last September. Prior to recent months, the last time the DSI saw even a single day’s reading at 90% was June 2007. At the March 2009 bottom, only 2% of traders were bullish, so today’s readings make quite a contrast in a short period of time.
  6. The Dow’s dividend yield is 2.5%. The only market tops of the past century at which this figure was lower are those of 2000 and 2007, when it was 1.4% and 2.1%, respectively. At the 1929 high, it was 2.9%.
  7. The price/earnings ratio, using four-quarter trailing real earnings, has improved tremendously, from 122 to 23. But 23 is in the area of the peak levels of P/E throughout the 20th century. Ratios of 6 or 7 occurred at major stock market bottoms during that time. P/E was infinite during the final quarter of 2008, when E was negative. We will see quite a few quarters of infinite P/E from 2010 to 2017.
  8. The Trading Index (TRIN) is a measure of how much volume it takes to move rising stocks vs. falling stocks on the NYSE. The 30-day moving average of daily closing TRIN readings has been sitting at 0.90, the lowest level since June 2007. This means that it has taken a lot of volume to make rising stocks go up vs. making falling stocks go down over the past 30-plus trading days. It means that buyers of rising stocks are expending more money to get the same result that sellers of declining stocks are getting. Usually long periods of low TRIN exhaust buying power.
For more market analysis and forecasts from Robert Prechter, download the rest of this 10-page issue of the Elliott Wave Theorist free from Elliott Wave International. Learn more here.

Robert Prechter, Chartered Market Technician, is the world's foremost expert on and proponent of the deflationary scenario. Prechter is the founder and CEO of Elliott Wave International, author of Wall Street best-sellers Conquer the Crash and Elliott Wave Principle and editor of The Elliott Wave Theorist monthly market letter since 1979.

Thursday, April 22, 2010

Are Stocks Overbought Right Now? Expert Market Technician Weighs In

A rare CNBC treat! An appearance from Elliott Wave's Steve Hochberg, as he shares his thoughts on why the current market looks (extremely) overbought, and why safety is the order of the day.


Best part of the interview for us EWI fans/subscribers - he gets fired up near the end, and mentions social mood as the driver of the stock market/economy! Yes, he went there, on mainstream financial TV! Love it.

Wednesday, April 21, 2010

An Exclusive Socionomic History of Goldman Sachs - Part 2

Here's Part 2 of EWI's guest expose on Goldman Sachs - if you missed Part 1, you can read that here - A Brief History of Goldman Sachs, Part I. Enjoy!

***

Goldman Sachs Charged With Fraud: Who Could Have Guessed? Part II

The firm's history suggests its vulnerability in periods of negative social mood.

By Elliott Wave International

In the November 2009 issue of Elliott Wave International's monthly Elliott Wave Financial Forecast, co-editors Steven Hochberg and Peter Kendall published a careful study of Goldman Sachs company history -- and made a sobering forecast for the firm's future: "Goldman Sachs will experience an epic fall."

In this special three-part series, we will release the entire Special Report to you free of charge.
Get tomorrow's financial news today! To understand what that means, you must think and act independently from the crowd. Learn how by downloading Elliott Wave International's FREE 118-page Independent Investor eBook here.
Special Section: A Flickering Financial Star (Part II)

Despite careful stewardship, Goldman's reputation faltered as stocks fell in 1969-1970. When the Penn Central Railroad went under, it was revealed that Goldman sold off most of its own Penn Central holdings before the June 1970 bankruptcy. This was another case of shifting standards, as Goldman's customers were all institutions dealing in unregistered commercial paper. They should have known the high odds of failure, as the railroad’s stock was down almost 90% when it finally failed.

As Cycle wave IV touched its low in October 1974 (S&P; see historic chart in Part I), a jury ruled, however, that Goldman “knew or should have known” that the railroad was in trouble. But Goldman Sachs company survived the negative judgment and grew quickly as the Cycle wave V bull market took off beginning in 1975.

As the chart shows, its rise to 2007 was meteoric. It was in this period that Goldman “reinvented itself” as a “risk-taking principal.” By 1994, Goldman Sachs: The Culture of Success (by Lisa Endlich) says compensation policies had tilted so heavily toward risk taking that one vice president noted, “everyone decided that they were going to become a proprietary trader.” In that year, the firm suffered its first capital loss in decades as stocks sputtered, but, within a year, the Great Asset Mania was in full force and Goldman's appetite for risk took off with that of the investment public.

In 1999, the last year of a 200-year Grand-Supercycle-degree bull market, Goldman Sachs, appropriately, went public, becoming the last major Wall Street partnership to do so. As Bob Prechter's Elliott Wave Theorist said at the time, “Some of the most conspicuous cashing in has come from the brokerage sector, which has a long history of reaching for the brass ring near peaks.”

The Partnership notes that by May 2006, when a wholesale financial flight to ever-riskier financial investments was in its very latter stages, Goldman had “the largest appetite and capacity for taking risks of all sorts, with the ability to commit substantial capital.” As other firms felt the sting of an emerging risk aversion, Goldman profited by shorting the subprime housing market and putting the squeeze on its rivals. The firm earned $11.6 billion in 2007, more than Morgan Stanley, Lehman Brothers, Bear Stearns and Citigroup combined. Merrill Lynch lost $7.8 billion that year.

Another bull market initiative explains Goldman's relative strength since 2007. It dates back to the hiring of a former U.S. Treasury Secretary, as the Dow peaked in Cycle III in 1968 (see chart in Part I). This was the firm’s first foray into the upper reaches of the U.S. government. In wave V, the flow of talent went the other way and tightened the bond, as executives regularly moved from Goldman to Washington. This process was aided in part by a Goldman policy that pays out all deferred compensation to any partner who accepts a senior position in the federal government.

In May 2006, Henry Paulson, Goldman's chairman, left to become Secretary of the U.S. Treasury. Over the course of wave V and its aftermath, when government was increasingly relied upon as the buyer of last resort, these associations proved valuable to Goldman. Eventually they will weigh heavily upon the firm, but the value persists for now because the government is playing its socionomic role and clinging tenaciously to the expired trend.

Another important late-cycle development is Goldman's all-out effort to court, rather than avoid, conflicts of interest. From the 1950s through the early 1980s, Goldman leaders assiduously avoided even the perception of a conflict of interest between the firm’s positions and those of its clients. Goldman's current leader, Lloyd Blankfein, “spends a significant part of his time managing real or perceived conflicts.” Says Blankfein, “If major clients -- governments, institutional investors, corporations, and wealthy families -- believe they can trust our judgment, we can invite them to partner with us and share in the success.”

The strategy paid off big in 2008 when Henry Paulson, who was still in charge at the Treasury, helped the taxpayer step in to rescue Goldman. According to a Vanity Fair article by Andrew Ross Sorkin, Paulson had signed an ethics letter agreeing to stay out of any matter related to Goldman. In September 2008, however, Paulson received a waiver that freed him “to help Goldman Sachs,” which was faltering under the financial meltdown of a Primary-degree bear market.

It may be that the best interests of Goldman are perfectly in line with those of the nation, but in the combative atmosphere of the next downtrend in social mood, we are quite sure that voters will not see it that way. Also, the potential for self-enrichment already appears to have overwhelmed a key player. The latest headlines reveal that another former Goldman Sachs chairman, Stephen Friedman, negotiated the “secret deal” that paid Goldman Sachs $14 billion for credit-default swaps from a bankrupt AIG. He did this as chairman of the New York Fed while also serving on the board of Goldman Sachs.
Get tomorrow's financial news today! To understand what that means, you must think and act independently from the crowd. Learn how by downloading Elliott Wave International's FREE 118-page Independent Investor eBook here.
This article was syndicated by Elliott Wave International. EWI is the world's largest market forecasting firm. Its staff of full-time analysts provides 24-hour-a-day market analysis to institutional and private investors around the world.

Ed. note - I am an EWI subscriber and affiliate - I highly recommend their work.

Monday, April 19, 2010

How to Differentiate an Inflation Induced Rally From a Normal Run-of-the-Mill Retracement

Just a retracement?
Or is the bull really back?
Maybe inflation?

Deflation Camp - Anyone Left?

Outside of a few lone voices, the deflation camp sure seems to be getting lonely. This is interesting, because the US markets have only now retraced 60% of their previous losses. An impressive rally, for sure, but still within the 38-62% "Fibonacci range" that is generally expected of retracements.

FWIW, the Great Depression retraced a little over 50% of its initial leg down - so we're ahead of the 1930 rally, but just by a bit.

It DOES feel like this rally has been going on forever - over 13 months old, it's sure been impressive in it's magnitude and duration. BUT, it is important to realize that nothing has been decided - at least yet - regarding whether this is a technical rally off of extremely oversold lows, or a brand new bender driven by trillions of new cash.

Viewed with 5 years of hindsight, the current rally looks a bit more "normal" than when you're living it day-to-day.

(Chart source: Yahoo Finance)

The Early Symptoms of Inflation?

What's tricky, though, is governments around the world ARE printing money as fast as they can. And the first symptoms of inflation typically show up in either asset prices, or commodity prices - or both.

Today, we've got asset prices rallying, with financial stocks leading the way - exactly the first place you'd expect to see this "new money" showing up. A lot of financial commentators I've heard recently - good ones too, not just CNBC talking heads - believe this rally is now being driven by newly printed money.

Personally I think it's too soon to tell - we've retraced 60%, not 100%, after all.

But, if we're trading short term, we...

Gotta Respect the 200-Day Moving Average

And revisiting the S&P chart once again, we are indeed still north of the 200-day moving average. Check out the last five years too - you could have done a lot worse than being long stocks when the S&P is trading above the average, and being short when it's below:

According to the 200-day SMA, you should ignore my calls for an impending decline. Instead, you'd set stops around this mark.

(Chart source: Yahoo finance)

So while I may continue to hoot and holler about the odds of a downturn far outweighing upside potential, to be honest, you should probably ignore me, and just respect your trailing stops!

And for more on the power of respecting the 200-day moving average, check out this excellent article from Steve Sjuggerud in Daily Wealth.

If Everything Tanks, What Would Hold Up?

Judging by the price action across the board last Friday - not too much...

Almost everything is getting kicked in the teeth today.

(Source: BarChart.com)

Crude oil and precious metals got taken to the woodshed along with stocks on Friday - no place to hide there.

One bright spot - actually I should say one dim but not dark spot - are the grains. They haven't rallied much this year to date, so there may not be much downside from here.

Grains, by the way, are still one of my favorite secular plays - I just think it's best to avoid them right now. If the Great Depression is a guide, then grains should lead the way out of the Greater Depression as they did last time around.

Some Deflationary Evidence: Two Revealing Charts of Consumer Credit Trends

Late last week, our good friend and fellow deflationist Carson sent over a link from Mish Shedlock's blog, reporting a sharp annualized decrease in consumer and revolving credit.

I just plotted the Fed's historical data since 1978 (which I chose because there was a single quarter anomaly in 1977 that I didn't feel like dealing with).

First, we see that consumer credit, as of February 2010, is decreasing at an annual rate of 5.5%:

Consumer credit, after trending positive YOY in January, is once again heading south.

Next we look at revolving credit, where the data is even uglier, both in current and historical terms. Revolving credit decreased at an annual rate of 13%:

Will this debt ever be paid off?

The sharp decline in revolving credit, which is defined as credit that does not have a fixed number of payments or payment schedule (think credit cards), would appear to support the debt deflation argument (of Robert Prechter, most notably) that much of the current debt outstanding is going to go unpaid.

So while the government has engaged in quantitative easing to "ease" the issuing of its own debt, it has not yet offered to print up some greenbacks to pay off the debt of American citizens.

Thus far, it appears Americans are still choking on their massive loads of accumulated debt, unwilling to take on more credit, no matter what the Fed does.

It will be interesting to see if the Fed is able to reverse these trends.

Though Maybe We Should Just Short American Stocks Right Now

What's the most damning future indicator for America's near term economic outlook?

How about the latest cover of Newsweek?


Uh oh!

PS: Hat tip to MarketFolly for the tip here.

PPS: If you're into contrary investment thinking, I'd HIGHLY recommend The Art of Contrary Thinking by Humphrey B. Neill, which I reviewed here (ironically the same week we interviewed MarketFolly for the blog too!)

Another Bernanke "Guru Moment" - An Instant Classic?

The man who proclaimed the subprime problem was "contained" in March 2007 (after which Jim Grant hilariously quipped "yeah, to planet earth") - is back in the news again with another "guru moment".

The Wall Street Journal reports:

The U.S. economy should continue to recover at a moderate pace this year, but it will take time to restore all the jobs lost during the recession, Federal Reserve Chairman Ben Bernanke said Wednesday.

In his latest assessment of the economy, Mr. Bernanke told a congressional committee the pace of the recovery this year will depend on if consumers spend and companies invest enough to make up for fading government support.

"On balance, the incoming data suggest that growth in private final demand will be sufficient to promote a moderate economic recovery in coming quarters," the Fed chief said to the Joint Economic Committee.

Any fellow contrarians want to take the "under" on Ben's latest gem?

Jim Rogers Says Get Ready for $2,000 Gold!

Here's the latest Jim Rogers interview on Bloomberg:

http://www.youtube.com/watch?v=c-vd1-Ec2FY

A short bit with another clueless interview, so there's not too much new:
  • Still likes commodities for another 5-10 years (based on the secular bull market beginning in 1999)
  • Thinks gold will top $2,000 by the end of the decade, thanks to money printing
Jim notoriously sandbags his own trading acumen - always insisting he's "no good" at calling price/timing specifics - yet those who follow him closely know he's often pretty accurate with these calls as well!

You may also like:
And My Current Positions - Cash, and Pass!

While it's very tempting to take a flyer short position, betting on a near-term decline, I'm going to actually respect the 200-day moving average this time. We'll see how it works out.

Other than some longer term short S&P and long US dollar positions I've got via ETF's, I'm mostly in cash, mostly waiting for the next mega leg down that I think is coming.

In retrospect I should have kept my long positions, and just kept moving up the trailing stops, until they were stopped out. Ah well, investing and trading is a lifelong learning process.

Have a great week in the markets!

Friday, April 16, 2010

What, If Anything, May Hold Up If (When?) Stocks Tank Again

Judging by the price action across the board today - not too much...

Almost everything is getting kicked in the teeth today.
(Source: BarChart.com)

Crude oil and precious metals are getting taken to the woodshed along with stocks today - no place to hide there.

One bright spot - actually I should say one dim but not dark spot - are the grains. They haven't rallied much this year to date, so there may not be much downside from here.

Grains, by the way, are still one of my favorite secular plays - I just think it's best to avoid them right now. If the Great Depression is a guide, then grains should lead the way out of the Greater Depression as they did last time around.


Wednesday, April 07, 2010

Why Marc Faber Is Predicting A Large Correction Right About...Now

About a month ago, Marc Faber told Bloomberg that we could easily see a correction of 20% if the S&P topped 1150 and approached 1200.

Well, it seems like we're just about there, so we'll see how Faber's near term musings fare in the weeks ahead.

You can check out a video of Faber's Bloomberg interview here.

Some other thoughts from Faber:
  • He thinks the Euro is very oversold, and can rally to 1.40 before going lower
  • Doesn't see anything much good about the Euro, or the Dollar, for that matter
  • Debt monetization is inevitable in the long run
  • He likes precious metals and Asian currencies - says "most currencies are sick"
  • Better to be in stocks than bonds over the next few years, because he expects increasing inflation
Faber's book Tomorrow's Gold is excellent by the way - if you haven't read it, and you are a Faber fan, I'd definitely recommend you pick up a copy.

Interestingly Faber was a deflationist when he wrote the book almost 10 years ago, and has since flipped to the inflation camp, because he believes that sovereign printing presses will overwhelm broader deflationary forces.


Nothing To See Here - VIX Hits 18-Month Low

Volatility on the S&P is nowhere to be seen these days - perhaps the market crash was merely a figment of our imaginations!

The VIX is low, and it continues to head lower.
(Source: Yahoo Finance)

As you can see from our experience in 2008, when the VIX breaks out, it breaks out in a big way. So a breakout on the VIX would be a good cue for us to start slamming the PANIC button as hard as humanly possible.

But for now, all is calm in the markets, as February's drop now looks like a pebble tossed in the pond in hindsight.

The VIX could continue to head lower - who knows - but one would have to expect a spike in our future again sooner rather than later.

Sunday, April 04, 2010

This Week in Finance: Templeton's Final Memo; Why Richard Russell's Worried About Bonds; QE Ends; and More!


Quantitative Easing Ends (At Least For Now)

April 1st marked the end of the Fed's renowned money printing program, also known as "Quantitative Easing" for those who prefer to stick their heads in the sand and ignore what's actually happening.


Under the (QE) program, the Federal Reserve graciously bought $1.25 trillion of mortgage-backed securities from panicky banks and hedge funds over the last 12 months. But now, it’s over. Today, the stock market lost an important undergarment… and we suspect it will begin sagging dramatically, soon.

In more direct terms, the Fed has stopped “funneling new fiat money into the mortgage-backed security market,” explains short side strategist Dan Amoss, “which, in turn, freed up extra cash for portfolio managers to recycle into bonds and stocks. This fiat money is the illusion of real savings. It goes a long way toward explaining how a country deficient in savings can fund massive government deficits at low rates and aggressively bid up the prices of stocks.”

So what happens now?

“We’ll see a more natural relationship between savings, money flows and stock and bond prices,” says Dan. “It probably won’t be good for bulls.”


We've had one day of trading since QE ended, and so far, so good. But it's early yet, and it will be interesting to see how long the markets can continue to seemingly levitate in thin air.

Of course, there's nothing to say the government will not reinstate QE the moment things head south again. In fact, gurus like Marc Faber assure this is a "sure thing" - that when the stock market turns south again, Bernanke will print and print and print until the markets turn around.

Ed. note: Big thank you to Agora Financial, publisher of The Daily Reckoning, for sponsoring the blog! Agora has a lot of great paid and free resources, and I'd encourage you to check them out. Please do me a favor and click on an ad or two of theirs - thanks!

*** A Word From Our Sponsor, Agora Financial ***

The “New” War That Could Rocket Oil Past $220 Before 2011

This shocking conflict is eight times bigger than the wars in Iraq or Afghanistan. It’s also lethal enough to at least DOUBLE the price of gas and oil before 2011…

Bunker down against soaring energy costs with the ONE "safe haven" financial plan that could pay you gains up to 668%. Read the full report.

***

Sir John Templeton’s Final Words: We're Screwed

Legendary investor John Templeton, who passed away in 2008, penned a final memorandum a few years before his passing entitled "Financial Chaos", in which he predicted bad things ahead for us.

A very sharp final call from a guy renowned for them throughout his career. Here are the prescient comments that Sir John left us with:

John M. Templeton
Lyford Cay, Nassau, Bahamas

June 15, 2005

MEMORANDUM

Financial Chaos – probably in many nations in the next five years. The word chaos is chosen to express likelihood of reduced profit margin at the same time as acceleration in cost of living.

Increasingly often, people ask my opinion on what is likely to happen financially. I am now thinking that the dangers are more numerous and larger than ever before in my lifetime. Quite likely, in the early months of 2005, the peak of prosperity is behind us.


In the past century, protection could be obtained by keeping your net worth in cash or government bonds. Now, the surplus capacities are so great that most currencies and bonds are likely to continue losing their purchasing power.

Mortgages and other forms of debts are over tenfold greater now than ever before 1970, which can cause manifold increases in bankruptcy auctions.

Surplus capacity, which leads to intense competition, has already shown devastating effects on companies who operate airlines and is now beginning to show in companies in ocean shipping and other activities. Also, the present surpluses of cash and liquid assets have pushed yields on bonds and mortgages almost to zero when adjusted for higher cost of living. Clearly, major corrections are likely in the next few years.


The Amount of Managed Money Currently Invested in Gold

Now that gold is rangebound, how do you make money trading it? That's easy - treat it like a wooden pony and straddle that thing.

For the details on this trade, in more professional terms as well, check out Brad Zigler's article for Hard Assets Investor:

So what's an investor to do? Well, you can certainly sit tight and wait. But if you do, you'd be passing up an opportunity the market doesn't hand out every day—cheap volatility premiums.

Option traders know all about volatility: It's one of the primary drivers of option costs. When volatility contracts, as tends to happen in range-bound markets, option prices soften. So much so, in fact, that the purchase of option straddles and strangles becomes attractive.

A straddle is a combination of a put and a call on the same asset, each sharing the same expiration date and exercise price. A strangle is similar, but the options' strike prices are different.


The potential risk here, at least IMHO, is if the next potential wave of deflation finally comes to fruition, taking down everything, gold included.

But if you believe that gold will be rangebound for a bit here, straddles are definitely an interesting potential play.

And here's a VERY interesting chart that Brad posted in his piece - it shows another reason some smart money is wary of gold at these prices - because managed money is heavily in gold right now, which often indicates a shorter term top in price:

Chart courtesy of Hard Assets Investor.

Gold has had a heckuva run, it could easily trade sideways, or even pull back sharply, and still be within the confines of a larger bull market. Nothing goes straight up or down - trade accordingly!


Why Richard Russell is Very Worried About the Bond Market

Richard Russell thinks the bond market may be saying ENOUGH with the quantitative easing, reports The Daily Crux.

From his Dow Theory Letters:

The bond market is now very close to saying, "We've had enough."

... Many older subscribers probably remember my lifelong emphasis on the POWER of COMPOUNDING. But what of the power of negative compounding on debt? I think we are about to find out.

The power of negative compounding will be brutal. The cost of carrying the world's debt (including the US national debt) will be devastating. It will be highly deflationary and it will crush everything in its path.


I don't subscribe to Russell, but I do try to follow his writings and thinking as best I can from the outside, and this is the first I've heard him mention deflation. Very interesting!

Here's what Russell had to say in early December about gold, the dollar, and the Fed's effort to re-inflate.


An Ominous Short-Term Chart

Anytime in history that the 12-month rate of change in the Dow Jones Industrial Average has topped 40%, there's generally been trouble ahead.

Guess what? The DJIA's 12-month ROC is above 40% right now!

Here's a great chart from Michael Panzner that you should check out:


The Magic of Obama's Healthcare Plan

Looks like I've got to eat some crow here - I'm on record as suggesting that Obama's Healthcare Plan would expedite the insolvency of the Federal Government.

Boy was I ever wrong!

Check out this hilarious video of Obama's magic healthcare math, where he rocks the stage in Ohio by speculating that insurance premiums could fall by up to - get this - 3,000%!


A Few More Links, In Case You Missed Them

My Current Positions and Market Outlook

The trend of all markets still appears to be up, but the risk appears to be predominantly to the downside. The only trend that appears to have changed for certain is that of the dollar, which is currently taking a breather after a multi-month rally.

The US dollar's trend is officially UP. It's well above it's 200-day moving average.
(Chart courtesy of StockCharts.com)

If the dollar is indeed the linchpin of the financial equation, then we'd expect the other markets to roll over one-by-one in turn here. We shall see if things play out this way.

(PS - Here's why I concur with folks who believe the dollar is the linchpin of the global financial markets).

Currently I am in wait and see mode, with no long or short futures positions.

Have a great week in the markets!

Monday, March 29, 2010

Why Some Key Charts Reveal the Reflation Rally May Be Tiring (Finally)

Trading From Ground Zero - We Don't Do It Enough

After going from Hero to Zero on the two S&P short positions, my March contracts expired, and I have not replaced them, instead opting to hang out in "wait and see" mode.

Contract expiration always tends to be a good exercise I find, as it forces me to ask myself "If I started over today, would I re-enter this position at current prices?" It's a question that we should ask ourselves more often - yet, we often don't, instead sitting and waiting for the market to turn our way.

Unfortunately, the market doesn't care what our positions are, it's going to go where it's going to go, whether we are long, short, or neither.


Checking in on Some Key Charts

Major indices hit new recovery highs today, with the DOW hitting it's highest mark in the last 18 months.

Trading volume remains tepid, however - as you can see from this chart of the S&P 500, this recent rally appears to lack some conviction:

Rallies have been occurring on lower volume than pullbacks.
(Chart courtesy of StockCharts.com)

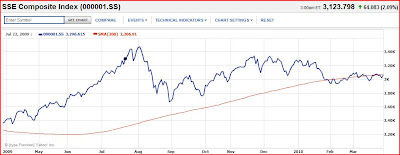
Chinese shareholders have been less exuberant of late than their American counterparts, as the Shanghai Composite Index continues to flirt with a breakdown beneath its 200 day moving average:

While US markets climb everyday, China huffs and puffs.
(Chart courtesy of Yahoo Finance).

Regular readers know that China is one of our favorite leading indicators. Is China's recovery running out of steam already?

The experts at Stratfor Global Intelligence believe that China's economy will be run on lending for at least the next year (free video clip here) - the result of which remains to be seen.

Commodities, also, continue to lag the rally in equities:

Like Chinese stocks, commodities are also well off of recovery highs.
(Chart courtesy of StockCharts.com)

Bottom Line: These non-confirmations could be ominous bearish divergences, indicating the reflation rally is on it's last legs. The rally appears tired, but is not over yet.

On the other hand, if all 3 of these charts confirm new recovery highs together, we'd have to conclude that this rally still has some room to run.


Bill Gross' Take on Portugal's Downgrade and Escaping the Sovereign Debt Trap

Ever wonder what the hell takes the rating agencies so long?

Last week, leading credit agency Fitch downgraded Portugal's debtamid "growing concerns about the government's ability to service it's borrowings."

Well - duh - increased borrowings coupled with decreasing tax revenues should raise concerns. What amazes me is that the Euro traded down today on the news - this shouldn't have been news at all, everybody saw this coming from Portugal as soon as Greece got the hiccups.

If the tax revenues were coming back, there might be hope - but revenues are not coming back anytime soon, so hope is bleak, if not non-existent. Europe is an economic basketcase with declining demographics - it's completely toast.

Bond king Bill Gross of Pimco weighed in today - in his eyes, there are three factors which could, at least theoretically, allow a country to escape the sovereign debt trap:
  • It must be able to print its own widely accepted currency
  • Have manageable budget deficits, and
  • Find investors willing to buy their bonds (Source: Forbes)
The US, for now at least, passes all 3 tests...Greece, Portugal, and the rest of the PIGS obviously do not. Much of the rest of the world does not either.

Is sovereign debt the next domino to tumble in the global financial crisis? It sure looks like things are teetering.


Why the Federal Deficit is in Even Worse Shape Than You Think

If there was any question before that the federal deficit was completely out of control and unsustainable, the successful passing of the "free healthcare for all" plan should completely seal the deal!

As you probably recall, the out-of-control debt spiral faced by our government sparked some interesting conversation at our local Casey phyle meeting about the safety, or lack thereof, of our retirement savings.

That conversation was originally inspired by a fine piece of analysis that Bud Conrad, Casey's Chief Economist, put together for The Casey Report. They've graciously given us permission to republish Bud's piece here, so read on to learn just how bad the federal deficit is:


Current Positions - None

I don't really like anything long or short right now. I guess if you had to make a short term call, you'd go short, with the markets being as overbought as they are right now (20 of 24 days up).

But, that's a tough one to time. And with the markets now again hitting new highs, the bear market rally that began last March may not be over yet.

Thursday, March 11, 2010

Well I'll Be Damned...The S&P Hits a 17 Month High(!)

Stocks continue to defy gravity, as the S&P finished today at a 17 month high.

Amazingly, the S&P has completely retraced it's most recent drop from January. The markets swung from quite oversold, to quite overbought, within the span of a month.

Once again, we learned (the hard way) not to bet against the S&P when it's north of the 200 day MA.
(Source: Yahoo Finance)

Where to from here? Well markets are overbought, and stocks have been rallying largely on low volume, so it's hard to see them going much higher before we see some sort of pullback.

Of course I'd have said the same thing a week ago, so take it for what's it's worth.

But I think the interesting thing to watch will be the conviction the upcoming pullback displays.

China, one of our favorite leading indicators, is NOT following the S&P's lead, however.

China on the brink - a potentially bearish divergence.

This could be a significant bearish divergence. The posterchild of the Reflation Trade, running out of gas!

As we always remind ourselves, the last time the markets crashed, China peaked before the US. History could be repeating itself here, as the US markets hit new highs, while China languishes below it's October highs.

Thursday, February 18, 2010

Bob Prechter: How to Act Contrary to "Market Herding"

Here's a great guest piece by Robert Prechter, author of what is currently my favorite investment newsletter, the Elliott Wave Theorist. Bob talks about a subject that's probably as near and dear to your heart as it is mine - market herding.

And if you want to read more, at the end of this piece there's an offer from Prechter that'll allow you to check out the entire issue of The Elliott Wave Theorist.

***

Robert Prechter on Herding and Markets' "Irony and Paradox"

To anyone new to socionomics, the stock market is saturated with paradox.

February 18, 2010

By Editorial Staff

The following is an excerpt from a classic issue of Robert Prechter's Elliott Wave Theorist. For a limited time, you can visit Elliott Wave International to download the rest of the 10-page issue free.

Market Herding

Have you ever watched a dog interact with its owner? The dog repeatedly looks at the owner, taking cues constantly. The owner is the leader, and the dog is a pack animal alert for every cue of what the owner wants it to do. Participants in the stock market are doing something similar. They constantly watch their fellows, alert for every clue of what they will do next. The difference is that there is no leader. The crowd is the perceived leader, but it comprises nothing but followers. When there is no leader to set the course, the herd cues only off itself, making the mood of the herd the only factor directing its actions.

Irony and Paradox

To anyone not versed in socionomics, everything the stock market does is saturated with paradox.

  • When T-bills sported double-digit interest rates in 1979-1984, investors saw no reason to abandon their T-bills for stocks; when T-bill rates were low in the 2000s, investors saw no reason to put up with the “low yield” of T-bills and sought capital gains in stocks. The first period was the greatest stock-buying opportunity in two generations, and the second period was the greatest stock-selling opportunity ever.
  • When long-term bonds yielded 15 percent in 1981, investors were afraid of Treasury bonds even though they were about to embark on the greatest bull market ever; in December 2008, when the Fed pledged to buy T-bonds, rising prices appeared so strongly guaranteed that the Daily Sentiment Index indicated a record 99 percent bulls, just before prices started to fall.
  • When oil was $10.35 a barrel in 1998, no one made a case that the world was running out of black gold; but when it was 7-8 times more expensive, some three dozen books came out arguing that global oil production had peaked, a theme that convinced investors to begin buying oil futures…about a year before the price collapsed 78 percent.
  • In the second half of the 1990s, the idea that stocks would always be the best investment “in the long run” became popular just as a long period of superior returns was coming to an ignoble end. A new study... shows that as of today the S&P has underperformed safe, boring Treasury bonds for the past 40 years, since 1969.
  • Just when nearly everyone -- including world-famous investors -- finally panicked and conceded in February-March 2009 that the financial and economic worlds were in dire shape, the market turned around and shot upward in its fastest rally in 76 years.

And so on. The exogenous-cause model fools investors exquisitely. One reason is that rationalization follows upon mood change. Mood change comes first, and attempts at reasoning come afterward. Socionomists recognize that social mood is primary and has consequences in social action, so we never have to wrestle with paradox. This orientation does not mean that we are always right. It means only that we are not doomed to be chronically wrong.

To succeed in the market, you must learn initially to embrace irony and paradox, at least as humans are unconsciously wired to interpret things. Once you get used to the world of socionomic causality, the irony and paradox melt away, and everything makes perfect sense...

***

Read the rest of this classic Elliott Wave Theorist issue now, free! You’ll get 10 pages of Bob Prechter's unique insights on:
  • Why Finance and Macroeconomics Are Not Subsets of Economics
  • How Correct Are Economists Who Forecast Macroeconomic Trends?
  • The “Beat the Market” Fallacy
  • Stock-Picking Geniuses or Just a Bull Market?
  • Index Funds and Diversification
  • Market Confidence vs. Certainty
  • Observations on Corporate Earnings
  • Why Being a Bear Doesn't Equal "Doom & Gloom"
  • More

Most Popular Articles This Month