Sunday, November 29, 2009

Dubai's Meltdown; Liquidity Flows Make the Markets; S&P Fair Value

Dubai's Meltdown

The Thanksgiving holiday is traditionally a very slow time for the markets...not so this year! Dubai rocked the financial world with its announcement to debtors that it needed a bit more time to make good on outstanding debt payments.

Uh oh - here we go again?

Global markets reacted quite violently to the news, throwing up with the vigor of a hungover Wet Wednesday reveler. The real news here is not Dubai in and of itself - a debt bender from a pretty small country can't do that much damage alone to the global financial system. But, if this is a harbinger of more sovereign defaults to come, then now may be the time to beat the Holiday investor crowd and check into the debt rehab clinic!

Is fear back in the markets? It's been a bear market in fear since the March lows - perhaps it's time for fear to bounce back. This week will sure be interesting.

What happens if fear bounces back? We've seen this playbook before, as Mr. Market has already given us a sneak preview...

All Markets are Driven by Liquidity Flows

Friday was a classic fear driven day lately, with the dollar rallying, and everything else dropping. This is the "All The Same Markets" theory we've been following closely for most of 2009, originally popularized by one of our favorite gurus, Robert Prechter.

Most people see that the asset markets are interconnected - it's the old reflation/deflation trade. But, why does the dollar move counter to all of these other markets?

The "flight to safety" explanation is a popular one, and I personally think it's as wrong as it is popular.

The reason the dollar rallies is not because it's perceived a safe currency, but paradoxically because it's the sickest one. The reason is that most of the debt in the world is denominated in US dollars. When that debt goes "poof" - that is, the borrower defaults, and the money that once was there ascends up to money heaven - the supply of money goes down.

When liquidity tightens, this debt can go "poof" in a hurry, as we saw during the last leg down of the stock market. This is highly deflationary. And, because most of this debt is denominated in dollars, the supply of US dollars drops, and the value of each remaining dollar goes up.

But Can't the Fed Print Money and Reflate?

Yes, but there are limits to what the Fed can do, at least in the short term. Even an expert money printer like Ben Bernanke has constraints - he's only human, after all.

When you consider the sum of outstanding credit is somewhere in the neighborhood of $50 to $100 trillion (give or take a trillion or ten), it makes the money the Fed has printed so far (a trillion or two) pale in comparison.

Can the Fed inflate eventually? Sure - but probably only after all of this bad debt has been destroyed. This could take a few years, and there will be some wicked asset deflation in the meantime.

(For further reading, check out Terry Coxon's article: When Will Inflation Really Hit Us?)

First Dubai, Then Greece?

Greece is warming up in the on deck circle, as it tests the levels of sovereign debt, writes Ambrose Evans-Pritchard for the Financial Times.

Evans-Pritchard reports that Greece is "disturbingly close to a debt compound spiral," - and the bond vigilantes appear to be circling the wagons.

S&P Fair Value: Lower Than Current Levels

My good friend, regular reader, and private wealth manager Jonathan Lederer put out an excellent quarterly update for his clients last week, in which he analyzed the valuation for the S&P 500.

Jonathan is a very sharp value investor who has the patience and insight to perform excellent valuation analysis on equities. I always benefit greatly from absorbing his research, which is often a great counterbalance to my views.

He's been kind enough to allow me to share his presentation with my readers, which you can view here...I would definitely recommend you spend some time to watch his quarterly update.

Spoiler alert: Jonathan concluded that the market valuations are a bit rich at current levels, which concurs with my thinking and belief that the market risk right now is to the downside.

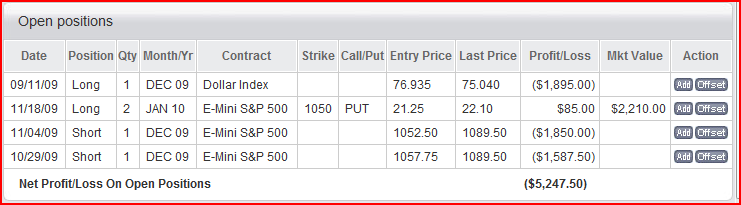
Positions Update - Still Really Short the S&P, Long the Dollar

And we continue to wait for these trades to go our way...was Dubai the opening shot in the next wave of deflation? The next week should be quite interesting!


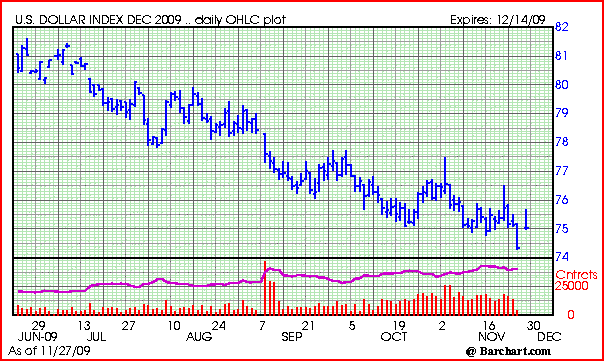
Was last week's downtick the bottom for the dollar?
(Source: Barchart.com)


The S&P rallied off it's deep lows on Friday, but still closed down big on the day.
(Source: Barchart.com)

Open positions:


Thanks for reading!

Current Account Value: $19,711.95

Cashed out: $20,000.00
Total value: $39,711.95
2009 Returns: Ugh, sick of calculating, too depressing!

Prior yearly returns:
2008: -8%
2007: 175%
2006: 60%
2005: 805%

Initial trading stake: $2,000

Sunday, November 22, 2009

More Signs the Stock Market (and Everything Else) May Finally Be Topping Out

The story of the investing week was the lack of confirmation of the new Dow and S&P highs by the secondary indices. Stock market tops often occur when sectors "peel away" from the up trend one by one, as fewer and fewer asset classes make new highs.

While this is no guarantee of a top, the odds certainly appear to favor a downturn more now than they have at any point since the March lows.

Steve Hochberg of Elliott Wave International was interviewed on the Financial Sense Newshour last Thursday - if you're into technical analysis and indicators, I'd definitely recommend a listen. I read Steve's market updates every Monday, Wednesday, and Friday - this interview will give you a good idea of what he's seeing.


What Markets are Peeling Away?

A lot of the junk that led this bear market bounce is starting to rollover. The poster child may be the banks - for example, the KBW Bank ETF (Ticker: KBE) still sits below its March lows:

Bank stocks rolling over again?
(Chart source: Google Finance)

And what about our favorite leading indicator, the Chinese stock market? Here the bulls may have some hope, as the Shanghai Composite Index looks to be making another run at new 2009 high.

China takes another run at its 2009 highs.
(Source: Yahoo Finance)

The final month of the year should be quite revealing - if the Shanghai Composite does not take out these highs, and instead puts in a "lower high" before turning lower, then it could be "look out below!"


Isn't Gold Signaling That Inflation is Here?

Gold at $1150, ironically, seems to be the "surest one way bet" in the market. I say ironically, because when gold was plunging last year below $800 and even $700, all the news and speculation seemed to be that there was no end to the drop in sight.

Now with gold going up seemingly everyday, there is now a "floor of $1000" below the price of gold, with a host of "fundamental" reasons being cited, such as China instructing its citizens to load up on bullion.

Also the falling dollar is being credited as a reason why gold is destined for $2000 or higher. That may be the case eventually, but for right now, the dollar appears to be bottoming (see chart below). When unrelenting bad news no longer pushes an asset down in price, it's probably set to rally, and that's what we're looking for out of the dollar in the near term.

The most interesting, and potentially damning, thing to me is the fact that, despite gold's spot price sitting over $100 higher from it's previous high in 2008, gold stocks are still below their previous 2008 highs.

Despite all the enthusiasm for gold's prospects, gold stocks have not (yet) taken out their 2008 highs. (Source: Yahoo Finance)

For the record, I do expect gold, and gold stocks, to go higher - eventually. But I think we're in for a huge deflationary wash out before that happens. We shall see, but this popular trade just seems way too obvious, and loved, right now.


Still "All the Same Markets"

It's worth noting that we still haven't seen any markets "decouple". Either everything rallies, and the dollar tanks, or the dollar rallies and everything else tanks. Until further notice, I still believe diversification is a waste of time.

For some background on the "all the same markets" theory, here's a post from earlier in the week.


Positions Update - Really Short the S&P, Long the Dollar

As if I wasn't already massively short the S&P, I also picked up a couple of cheap puts on the S&P at 1050. These puts are slightly profitable, while the futures positions continue to show a loss.

Going forward, I may look to buy more "out of the money" puts on the S&P, as I expect it to be heading to much lower levels.

The dollar still searches for a bottom.
(Source: Barchart.com)


Did the S&P finally put in a top early last week?
(Source: Barchart.com)

Open positions:


Thanks for reading!

Current Account Value: $20,266.95

Cashed out: $20,000.00
Total value: $40,266.95
2009 Returns: Ugh, sick of calculating, too depressing!

Prior yearly returns:
2008: -8%
2007: 175%
2006: 60%
2005: 805%

Initial trading stake: $2,000

Thursday, November 19, 2009

Still All The Same Markets - A Picture Worth a Thousand Charts

This shot says it all - the "all the same markets" hypothesis is still in play.

Why bother with diversification when all the markets move in tandem?
(Source: Barchart.com)

Hat tip to Robert Prechter, who I believe was the first to point out the increasing correlation between every asset class, as far back as 2004. He postulated that the markets were being driven by global liquidity flows:
  • When liquidity is plentiful (2004-2007), all the markets rise together, the dollar drops
  • When liquidity dries up, the dollar rallies, all markets tank (2008 - early 2009)
Since March, we've seen liquidity increasing, and the dollar dropping - still playing according to script. So I think we have to assume this relationship is still in place, until proven otherwise.

Nothing's Changed - Stocks Topping, Dollar Bottoming

Did the intermediate top in stocks occur earlier this week? We won't know for sure for many months, but it certainly COULD have been.

The rally has been running on fumes for month, yet still moving upwards despite the naysayers (such as myself), as the S&P pushed above the 1100 mark (raise your hand if you expected that when the S&P was bottoming at 667!)

Nevertheless, all good things must come to an end eventually - and while this rally has been an impressive one, it's magnitude has occurred completely within the normal confines of a bear market rally.

A couple of weeks back, we compared the 2009 rally with the 1930 stock market rally, and found a lot of similarities. Of course you can find similarities in anything if you look hard enough, but my point was that whether or not this rally was for real was still "to be determined", as thus far it's done exactly what it was supposed to - make everyone think that it was OK to get back in the waters.

Remember earlier this year when stocks were again "risky"? Not anymore! Every drop is once again a buying opportunity. Which is exactly when things get the most dangerous.

For fellow "armchair stock market technicians", The Daily Reckoning's Eric Fry cited "a very serious negative divergence" pointed out by options expert Jay Shartsis:

"The new Dow highs have not been confirmed by the widely-based Value Line (over 2300 stocks)," Shartsis points out, "and divergences between these two indices have marked important turning points in the market in past years. This divergence, in my opinion, trumps the still bullish sentiment data and calls for a stock thrashing dead ahead.

"Traders should also note that a head-and-shoulders top is building on the Value Line Index," Shartsis continues, "with the right shoulder top lower than that of the left - an extra bearish element. At the current 2,138, the Value Line is about 4% from a new high and it doesn't look like it is headed back to that level any time soon."

Source: The Daily Reckoning, a FREE daily e-letter, offers a "uniquely refreshing" perspective on the global economy, investing, and today's markets.

What's the script when stocks turn down? The market gave us a sneak preview last year - it's everything else down too, dollar up!

Now may be an interesting time to pick up some cheap put options on the S&P, especially some of the "black swan" variety, in case this downturn has some umph behind it!

Ed. Note: On Sunday we reviewed Financial Reckoning Day Fallout, the latest book by the authors of The Daily Reckoning.

Monday, November 16, 2009

Jim Rogers: Gold Will Top $2,000; Bernanke Should Resign; Buy Coffee

Our hero Jim Rogers has been back in the news quite a bit recently - here's his latest thoughts:
Even if deflation does win the day in the near term, it does seem like gold is destined for $2,000 before this secular commodity bull market is over. If you're an investor, the best thing to do is probably to continue to accumulate gold, without worrying about the price.

As a trader, though, I'd be very cautious about gold in the short term. I think we're at a key inflection point in the inflation/deflation battle, and personally I'm wary that 2010 will usher in the return of DE-flation in a big way.

Sunday, November 15, 2009

Financial Reckoning Day Fallout: Surviving Today's Global Depression - Book Review

Coast to coast flights are fantastic for getting uninterrupted reading time in, and on my flight back to the West Coast last Monday, I was able to devour Financial Reckoning Day Fallout: Surviving Today's Global Depression, by Bill Bonner and Addison Wiggin.

Bonner and Wiggin are the two top guys at Agora Financial, an extremely successful investment publishing house that is as renowned for their marketing prowess as they are for the high quality of their investment research and newsletters. You may be familiar with many of their free or paid investment products, such as The Daily Reckoning, a free daily e-letter they've published since 1999.

A quick note on Bill Bonner before we get into the book - the more I follow his writings and career, the more I'm in pure awe of the guy. A really, really smart dude...and that's an understatement. Not only is he an astute investor, a stellar writer, but he also founded and built Agora Financial into a publishing powerhouse. A true renaissance man with awesome accomplishments.

Bonner and Wiggin originally wrote Financial Reckoning Day earlier this decade, predicting a long, soft depression for the United States. I've been a reader of The Daily Reckoning since 2004, where they've continued to follow, update, and expand upon their original hypothesis that the US was destined to follow in Japan's economic footsteps with a long, slow, soft depression.

The credit and debt explosion in the middle of this decade drove up one last asset bubble that tested the patience of investors who shared these bearish views. But ultimately their patience has been rewarded, as the authors;: "trade of the decade" - long gold and short stocks - has been right on the money.

Financial Reckoning Day Fallout begins by revisiting the hysteria of the tech bubble, which, as time passes, seems to increase in absurdity for me personally. The authors polk fun at George Gilder, the "messiah" of the of the New Era.

Gilder's articles in Forbes ASAP were not merely hard to read, they were incomprehensible. But never mind. He was a genius...but he had worked himself into such a state of rapture over the possibilities of the Internet that he seemed to have gone a little mad.

One caveat, "I don't do price," Gilder commented. Too bad. Because, as investors would discover later, prices are important. A technology may be spectacular; the company owns it may be a great company; but the stock is only a good investment at the right price.

Lest we be tempted to think of the tech bubble as a unique occurence, the next chapter, entitled Progress, Perfectibility, and the End of History, pays an amusing tribute to other times in history in which men have declared the entire race of humanity to have been perfected, or nearly so.

Francis Fukuyama takes a solid ribbing for his essay, which he published in 1989, entitled "The End of History."

The document was remarkable; for rarely did someone manage to get so much so wrong in such a short essay. Fukuyama saw all of history as a march toward democracy and capitalism. He believed the collapse of communism marked the triumph of both...and hence, history was dead.

If sarcasm, witty humor, and history are your cup of tea, then you'll get a real kick out of this book. Bonner and Wiggin are real students of history, and their true talent is their ability to relate back tales in a very funny, insightful way.

John Law, perhaps the ultimate target for the authors, has a whole chapter devoted to his financial shennanigans. Law, you may recall, is the "financial genius" who is largely credited as the father of paper money. An innovative money printer who would even put Bernanke & Co to shame, his inflationary creation is largely responsible for the Mississippi Scheme and South Sea Bubble manias - amusing accounts of both are contained in this chapter.

Alan Greenspan's career is also traced through, also in farcical fashion. I knew he had libertarian leanings when he began his career, but did not realize the extent to which he was a disciple of Ayn Rand and hard money. It was eye opening to see how much the political world corrupted Greenspan's views - which were reinforced by the seeming success he was having in "guiding" the economy to steady booms and soft landings.

There are a couple of chapters devoted to the comparison of the US with Japan (the parallels of which are downright scary), along with the demographic sledgehammer the US is about to be hit over the head with. Some of Harry Dent's demographic research is cited here.

The book wraps up with one of my favorite chapters, in which the authors introduce the concept of Ought. The idea is that no matter how many numbers you crunch, markets are the ultimate arbiters of morality. Everything that "Ought" to happen usually does, in which financial sinners are published for their transgressions, and fools are ultimately separated from their foolishly invested capital.

Here's an intro to Ought - which made me laugh out loud several times on the plane:

If "Ought" were a person, Ought would not be a bartender or a good-hearted prostitute. Ought is not the kind of word you would want to hang out with on a Saturday night, or relax at home for it would always be reminding you to take out the trash or fix the garage door.

If it were a Latin noun, Ought would be feminine, but more like a shrewish wife than a willing mistress. For Ought is judgemental - a nag, a scold. Even the sound of it is sharp; it comes up from the throat, like a dagger and heads right for the soft tissue, remembering the location of weak spots and raw nerves for many years.

Ought is neither a good-time girl nor a boom-time companion, but more like I-told-you-so who hands you asprin on Sunday morning, tells you what a fool you were, and warns you what will happen if you keep it up. "You get what you deserve," she reminds you.

Financial Reckoning Day Fallout is different from most investment books in that it will not give you specific investment advice per se - which is exactly what I like best about it. Most investment books that give advice end up being completely wrong - typically more of a contrarian signal than anything - seen any good books about making millions in real estate lately?

I prefer books like this one, which challenge your assumptions, and help develop and shape your thinking. I tend to read very few newly released books in the finance/investing genre, finding most of them to be shallow and full of bad advice. Tried and true investment insights, though, are timeless. And I think this is a book you could pick up 25 years from now, and still get just as much out of.

I'll close by sharing that I find the doom and gloom that Bonner and Wiggin revel in absolutely hysterical. When my wife saw the title of this book, she remarked that it's a wonder I'm not suicidal. I happily showed her a few of the chapter subheads during the flight, my favorite being "How to Relax and Enjoy the End of the World." Really funny stuff.


Marc Faber in the Daily Reckoning

Speaking of The Daily Reckoning, Marc Faber wrote a guest essay in Wednesday's edition entitled When Currencies Crash.

Faber believes the US is dedicated to debasing its currency - which I think everyone agrees upon. The question is - will they be able to successfully do it?

Anyway a good read for Faber fans - I love to read anything he writes.


Is This Rally Finally Losing Steam?

Tom Dyson believes so. I know we've been crying wolf about this for a little while, but there are some real telling signs that could be foreshadowing an end of this rally.


Positions Update - Short the S&P, Long the Dollar

That's our story, and we're sticking to it! I was definitely early on both trades - time will tell if I was merely early, or flat wrong. Reason #78 why trying to time tops/bottoms is a fool's game!

The market is quite overbought, and should open lower this week. How much lower it heads will be interesting to see.

We have many divergences taking place - the "junk", such as bank stocks, have not confirmed these new highs yet. Neither has oil, and neither has China. So for now, we wait.

The dollar still searches for a bottom.
(Source: Barchart.com)


Was last week a countertrend bounce for the S&P, or the start of a rally to new highs?
(Source: Barchart.com)

Open positions:


Thanks for reading!

Current Account Value: $20,012.03

Cashed out: $20,000.00
Total value: $40,012.03
2009 Returns: Ugh, sick of calculating, too depressing!

Prior yearly returns:
2008: -8%
2007: 175%
2006: 60%
2005: 805%

Initial trading stake: $2,000.00

Tuesday, November 10, 2009

No Follow Through Today (Yet) From the S&P

With the DOW pushing to new 2009 highs yesterday, I was looking forward to today to see if the S&P could confirm the DOW's push - which would indicate that this rally is still on.

Yesterday's push was quite impressive across the board, but thus far today, we have not yet witnessed any decisive follow through. After 6 consecutive positive days, you'd expect the markets would need a breather at some point.

However, if the S&P turns down again before failing to break it's October highs, that would be a bearish looking "double top".

The S&P is bumping up against strong resistance (again) around 1100.
(Source: Barchart.com)

Monday, November 09, 2009

Boy, Is CNBC Yucking It Up Today!

I'm working from the road today, so I've got the nice benefit of having CNBC on here - man, are they yucking it up today!

With the Dow hitting a new 2009 high, I haven't heard anyone expressing any skepticism - "all the stars are aligned for higher stocks" is something that was just pronounced!

Best part of the day so far, they just paraded out a dollar bull like a sacrificial lamb, asked him when he was going to give up on that losing trade, and then cut to commercial during his response.

Of course I have been wrong for the past few months on this, so you are welcome to ignore my musings as you'd like. Worth noting that even I felt like throwing in the towel on my bearish stance midday today - and you know what happens when the last bear finally capitulates...look out below!

Sunday, November 08, 2009

Comparing the 2008-09 Stock Market With the Great Depression's 1st Leg Down

This epic stock market rally has done exactly what it was supposed to do - it's retraced about half of the losses from the previous crash. It's got folks feeling comfortable again - while maybe not outright enthusiastic about things, they now believe the carpet is not going to be pulled out from under them.

That's exactly what buying stocks now is a more dangerous proposition than it has been anytime this year thus far.

So can big rallies, following big crashes, be sustained?

I did a little bit of digging through historical data, to see if there was a case where a severe crash was isolated - that is, it retraced back up, and there was nothing more to it. Typically, crashes occur in three legs down (five "waves" in total, counting two countertrend bounces) - at least this was my belief, which I wanted to double check.

I'm going to compare this market crash/rally with the crash/rally from 1929/1930, and only that, because I was not able to find another market crash, and subsequent rally, as severe as what we've experience over the past year or two (severe being 50%). I wish we had another example to look at, but I wasn't able to find one since 1900 in the US that met this criteria!

The Great Depression's first leg down, and the 2008-09 markets, are in rarified air that meets these stomach churning guidelines:
  1. A ~50% stock market drop
  2. Followed by a ~50% stock market rally
Astute traders and investors, no doubt of which our readers here are, know full well that 50% down, followed by 50% up, does not get you back to break even!

First, let's take a look at the first leg down of the Great Depression, using the Dow Jones Industrial Average (DJIA) as our measuring stick.

Source: StockCharts.com

Date DJIA % Change # Days
09/03/1929 381.17
11/13/1929 198.69 -48% 71
04/17/1930 294.07 +48% 155

You have to love the symmetry of the 1930 rally! 48% down, then 48% up...before turning back down. Eventually the DJIA bottomed in 1932 at 41 - shedding an awesome 80% from the Dow's 1929 high.

Now, let's check out the newly minted Crash of 2008:

Source: StockCharts.com

Date DJIA % Change # Days
10/09/2007 14164
03/10/2009 6547 -54% 518
10/19/2009 10092 +54% 223


Oh the symmetry is fantastic! This time we retraced 54%, after giving up 54% initially - again roughly 50%.

Now, the million dollar question is: "Where to next?"

It's hard to make an argument for stocks continuing their rally from here. They are expensive by all traditional valuation measures, the economic recovery is not robust (maybe even non-existent), and until proven otherwise, this rally has been nothing more than a standard retracement.

The stock market doesn't just drop 50% for no good reason. Something more is usually amiss. Judging from the only recent historical analogy we have to use, caution is still the order of the day!


Positions Update - Even Shorter the S&P

A disappointing week for us dollar bulls/S&P bears. But, after 5 consecutive up days for stocks, we are not yet at new highs - nor are we at new lows for the dollar.

So, until further notice, I am classifying last week as a countertrend bounce, which could reverse as soon as tomorrow.

I did short another S&P contract on this rally - currently underwater on that position - so we shall see if that was a wise move in the weeks to come.

The dollar continues to muddle along - with strong support at 75.
(Source: Barchart.com)

Was last week a countertrend bounce for the S&P, or the start of a rally to new highs?
(Source: Barchart.com)

Open positions:

Thanks for reading!

Current Account Value: $22,947.03

Cashed out: $20,000.00
Total value: $42,947.03
Weekly return: -11.6%
2009 YTD return: -54.8%

Prior yearly returns:
2008: -8%
2007: 175%
2006: 60%
2005: 805%

Initial trading stake: $2,000.00

Friday, November 06, 2009

A Look Into Record High Trading Volume...And What It Says About Investor Confidence

The following article was adapted from the November 2009 Elliott Wave Financial Forecast and reprinted with permission here.

Steve Hochberg and Pete Kendall produce stellar analysis for Elliott Wave International - two of my favorite guys in the biz - here, they take a look at trading volume, and what it says about investor confidence. Read on, and enjoy!

***

Finance's Euphoria: The Epilogue -- What Record High Dollar Volume of Trading Says About Confidence

November 6, 2009

Until Nov. 11, you can read the rest of this brand-new report for free, during Elliott Wave International's FreeWeek of U.S. forecasts. Learn more about FreeWeek, and download the rest of this report and others for free here.

By Steve Hochberg and Pete Kendall

When Wall Street’s total value of assets rose to a “mind-boggling 36.6 percent of GDP” in late 2006, The Elliott Wave Financial Forecast published a chart of U.S. financial assets literally rising off the page.


The Financial Forecast observed that financial engineers had “found a new object of investor affections—themselves” and asserted that “the financial industry’s position so close to the center of the mania can mean only one thing; it is only a matter of time” before a massive reversal grabbed hold. Financial indexes hit their all-time peak within a matter of weeks, in February. The major stock indexes joined the topping process in October 2007 and in December 2007 the economy followed. Subscribers will recall that one of the most important clues to the unfolding disaster was the level of financial exuberance relative to the fundamental economic performance.

This chart of the value of U.S. trading volume (courtesy of Alan Newman at www.cross-currents.net) reveals that the imbalance is far from corrected.


Incredibly, total dollar trading volume is even higher now than it was in 2007 when the economy was humming along. In June 2008, dollar trading volume also defied an initial thrust lower in stocks and the economy, eliciting this comment from the Financial Forecast:

The chart of dollar trading relative to GDP shows how much more willing investors are to trade shares in companies that operate in an economic environment that is anemic compared to that of the mid-1960s. A basic implication of the Wave Principle is that the public will always show up at the end of a rally, just in time to get clobbered. This chart shows that it is happening in a big, big way now because the market is at the precipice of the biggest decline in a long, long time.

Total dollar volume continues to rise despite further fundamental financial deterioration. Yes, GDP experienced a one-quarter, clunker-aided uptick of 3.5 percent in the third quarter. But the economy is in far worse shape than it was when we made the above statement. In fact, its recent performance on top of the decades-long economic underperformance (which is discussed extensively in Chapter 1 and Appendix E of the new edition of Robert Prechter's Conquer the Crash) means that industrial production just experienced its worst decade since 1930-1939. Total manufacturing employment slipped to 11.7 million people, its lowest level since May 1941 when it was 33 percent of all jobs. According to Bianco Research, manufacturing now accounts for only about 9 percent of the workforce. Finance anchors the economy now, which makes it far more susceptible to non-rational dynamics.

As Prechter and Parker explain in “The Financial/Economic Dichotomy” (May 2007, Journal of Behavioral Finance), a financial system is not bound by the laws of supply and demand in the same way that an industrial economy is. In finance, confidence and fear rule decisions. “In the financial context,” say Prechter and Parker, “knowing what you think is not enough; you have to try to guess what everyone else will think.”

We do know one thing: When everyone is thinking the same, the opposite will happen.

Right now, record high dollar volume of trading shows that confidence, at least on this basis, has reached a new historic extreme.

***

Read the rest of the 10-page November 2009 Elliott Wave Financial Forecast now, when you signup for Elliott Wave International's FreeWeek of U.S. forecasts. FreeWeek ends Nov. 11, so please act now to get an enormous wealth of current market analysis and forecasts -- for free. Learn more about FreeWeek, and download the rest of this report and others for free here.

Steve Hochberg and Pete Kendall are co-editors of the Elliott Wave Financial Forecast.

Why Nouriel Roubini Thinks Commodities Will Correct, and Dollar Will Rally...Eventually

Nouriel Roubini thinks that commodities and equities have gotten ahead of their fundamentals - now pricing in a "V-shaped" recovery, which Roubini thinks is unlikely (I agree).

Here's an interview with Roubini conducted by our friend Lara Crigger at Hard Assets Investor.

Well, in my view, commodity prices have increased since the beginning of the year too much, too fast, when compared to the improvement in economic fundamentals. Some of that increase is justified. But if the global economy were to have a more anemic, subpar recovery—if instead of a V-shaped recovery, there's going to be a U-shaped recovery—then I actually think demand for commodities would be weak compared to supply, and there could be a correction in commodity prices in 2010.

Take oil prices: They have gone up from $30/barrel to over $80, at a time when demand is back to 2005 levels, and oil inventory is at all-time highs. Part of the increase is justified by fundamentals. But part of it is essentially this wall of liquidity chasing assets, and the effect of carry trade on the U.S. dollar, driving further higher these commodity prices.

So these nonfundamental factors can push oil and commodity prices higher, especially if there's going to be an increase in expected inflation. But the fundamentals of supply and demand actually suggest that, from now on, oil and other commodity prices should be lower, rather than higher.

Also Roubini was also on CNBC, where he described the reversal of the dollar carry trade that he is anticipating at some point in the future. The results are similar to the "All the same markets" theory that Robert Prechter coined, in which the dollar will rally and all other asset markets will tank.

Here's the CNBC interview, which runs about 8 minutes:


Thursday, November 05, 2009

Inflaton Isn't Here Yet - Here's When You Can Expect It

A couple of Sundays ago, I spent the morning reviewing the best inflation and deflation arguments and articles that I'd read since the financial world began falling apart. The inflation perspective that I enjoyed the most was that of Terry Coxon, editor of The Casey Report.

Below is one of Terry's recent pieces, which takes a look at the timing of a potential wave of inflation. I was fortunate that the Casey folks granted me permission to reprint the piece below.

Enjoy Terry's guest piece, as he explores what we can expect from inflation over the next few months and years.

***

When Will Inflation Really Hit Us?

By Terry Coxon, Editor, The Casey Report

Most of us are gathered at the station, watching for the Inflation Express to come rumbling in. But we've been waiting for a while now. Just when should we expect the big locomotive to arrive and start pushing the prices of most things uphill?

We’d all like to know the exact date, of course, but no one can know for sure. Not even a careful reading of the Mayan calendar will help. What we can do is estimate a time range for price inflation to show up, and that alone should have some important implications for investment decisions.

Why It’s Expected

The reason for expecting price inflation is the recent, rapid growth in the money supply and the deficit-driven likelihood that more such growth is coming.

As of July, the M1 money supply (currency held by the public plus checking deposits) had grown 17.5% in a year's time. That's not just unusually rapid, it's extraordinarily rapid. Since 1959, M1 has grown more rapidly in only one other 12-month period – and that was the one ending last June, when the M1 money supply jumped 18.4%. Even in the inflation-plagued 1970s, growth in M1 never exceeded 10% in any 12 months.

Dropping large chunks of newly created money into the economy leads to price inflation, because the recipients are likely to find themselves overprovisioned with cash. As they try to unload the excess, they bid up the prices of the things they buy, whether it be stocks, shoes, gasoline, silver coins, or granola. The sellers of those things then find themselves cash rich and start doing some buying of their own, and so the wave of excess money and the bidding it inspires propagate through the economy.

The process isn't instantaneous. It takes time. Just as each player in the economy has a sense of how much of his wealth he wants to hold in the form of money, everyone will move at his own speed to make adjustments when his actual cash holdings seem to be off target.

And the process can seem to stall, especially when fear is growing. When people are worried or otherwise feel a heightened sense of uncertainty, they will gladly hold on to abnormally large amounts of cash – for a while. But when fear abates, as it will when the economy begins to recover from the recession, that temporary demand for extra cash will also fade, and the hot-potato process of trying to pare down cash balances will emerge to do its inflationary work.

But when?

The speed at which the public tries to unload excess cash and the timing of the effects have actually been measured, in the work of the late Milton Friedman and his monetarist colleagues.

The method was indirect and roundabout, and so the results, unsurprisingly, were nothing as precise as nailing down the value of a physical constant.

What the monetarists (or the first of them to be equipped with computers) found was that when the growth rate of the money supply rises:
  • The initial effect is on the prices of bonds and stocks, an effect that comes within a few months.
  • The peak effect on the growth rate of economic activity comes about 18 to 30 months after the pick-up in the growth rate of the money supply.
  • The peak effect on the rate of consumer price inflation comes about 12 to 18 months after that, which is to say it comes 30 to 48 months after the peak growth rate in the money supply.
As Friedman famously put it, the lags in the effects of changes in monetary policy are "long and variable." He might have said, "It's a big, wide blur, but we're sure we've seen it."

And even that picture exaggerates the precision that's available to us. The emergence of money substitutes, such as NOW accounts and money market funds, has added its own muddiness to the picture of how growth in the money supply translates into growth in the level of consumer prices. It is only because the recent episode of monetary expansion has been so extreme that we can look to the results just listed for an indication of what's to come.

If you apply the findings of the monetarists to the present situation, here's what you get. The peak growth rate in the money supply occurred last December, so based on the general monetarist schedule:
  • Some of the effect on stocks and bonds should already have been felt.
  • The peak effect on economic activity should come between the middle of 2010 and the middle of 2011.
  • The peak effect on consumer price inflation should come between the middle of 2011 and the end of 2012.
A More Particular Schedule

This time around, should we expect things to move more rapidly or more slowly than average? My bet is on slow, which would push the peak inflation rate out toward the end of 2012. One reason for slow is that the government's rescue packages are delaying the process. Rescuing banks that are choking on bad loans postpones the day of reckoning for both the banks and the loan customers. It retards the pace of foreclosure sales (whether of real estate or other collateral) and puts the deleveraging that has been going on since last fall into slow motion. A wilting of the recent stock market rally would confirm this.

Investment Implications

The big plus about the Mayan calendar is that, right or wrong, it is very definite about things. Human civilization will come to an end, I'm told, on Dec. 21, 2012 – not on the 20th and not on the 22nd. There was no room for monetarists in those step-sided pyramids, but there still are few what-to-do implications from the monetarist findings.
  1. When you hear would-be opinion leaders cite the current absence of rising prices at the supermarket as proof that all the new money isn't a source of inflation, don't believe them. It is much too early for the inflation bomb to be going off, even though the powder has been packed and the fuse has been lit.

  2. If the large and growing federal deficits and the Federal Reserve's unprecedentedly easy policies tempt you to leverage up on inflation-sensitive assets, such as gold, give the idea a second thought. It likely will be a year or more until price inflation becomes obvious and undeniable (which is what it would take to bring the general public into the gold market). In the meantime, your inflation-sensitive assets could get paddled rudely as the deleveraging that began last year continues.
For at least the next year, the simple, fire-and-forget strategy is 50-50 gold and cash – gold for what looks to be inevitable but on its own schedule, cash to be ready for the bargains that may show up while we're waiting for the inevitable to arrive.

The editors of The Casey Report keep their ears to the ground, listening for the first rumblings of the inflation stampede coming in. But you can bet on rising inflation – and interest rates – right now and be way ahead of the investing herd. To learn more about investing in this all but inevitable trend, click here.

Sunday, November 01, 2009

Does News Drive the Markets? A Closer Look at This Old Wive's Tale

With the markets at a potential inflection point (an inflection point down, in my humble opinion), I thought it'd be fun and instructive to revisit a topic we've noodled on a bit lately.

Does News Actually Drive the Financial Markets?

It's common knowledge that increasing earnings drive stock prices - with the only caveat being that there's no evidence of this being true. A couple of weeks ago, we posted a short guest article that challenged this assumption, making the case that stock prices actually drive earnings, not the other way around.

Since I'm becoming more and more sympathetic to this outlook of the markets driving the news, I thought it'd be a fun exercise to take a closer look at this hypothesis.

To be as objective as possible, I conducted a few searches using the Google News search function, so that we could count up the number of stories that contained my search phrase. First up...

Bear Market Rally

Stories about the bear market rally have tapered off - it's a new bull market!
(Source: Google News)

How ironic that the number of news stories about a "Bear Market Rally" peaked in March...the month the rally was just beginning! Being a somewhat disparaging term, I find it fitting that the use of this phrase in news headlines has dissipated as the markets have rallied.

I'd imagine the reason is this rally no longer viewed as a mere bear market rally, but a new bull market! Probably just in time for the markets to turn down once again.

The grand prize goes to the Financial Post, for their March 5th article Talk of a 'bear market rally' may be premature. It sure was - by about 24 hours!

Bond Vigilantes

Why do interest rates rise and fall? It's a complex question - one that appears to be too complex for the news headlines to adequately explain!

In June, the return of the "bond vigilantes" was a popular reason for soaring yields on long dated US government bonds. The bond markets were pissed, and ready to raise hell about soaring government deficits.

The only problem about investing based on the "news" that the bond vigilantes had returned, ready to drive up yields further, is that your timing would have been exactly wrong.

Yields topped along with this news, and both have quietly rode off into the sunset since.

2009 news about the "Bond Vigilantes" peaked in June.
(Source: Google News)


Right along with yields
(Source: Yahoo Finance)

Dollar Reserve Currency

Here's one near and dear to my heart - the overblown reporting of the dollar's reserve currency status being in imminent danger. You'll notice there was a low, steady hum of stories - up until March of this year, when the dollar topped out (for the time being).

News of the dollar's demise really picked up AFTER it started to decline.
Source: Google News

Since then, the dollar has been declining, and stories of the dollar being replaced as the world's reserve currency have been all over the financial media. My favorite was a recent story in London's Independent entitled The Demise of the Dollar, which may have coincided with a significant bottom in the dollar index, which has rallied steadily since!

Bottom line: Using the news to trade is a losing proposition...you'd be much better off using the charts to predict the news. The financial news media is a fantastic example of groupthink at it's best, or worst, depending on your perspective.

You can always count on financial news stories to break after the market has already tipped it's hand!


The Start of a Larger Decline?

Many of the technical indicators I follow appear to be signaling a shift is taking place in the markets, in which the dollar will once again reign supreme, and everything else should roll over. In other words, an instant replay of the last bit of deleveraging, though probably worse.

To get the "average investor" sentiment after Friday's big decline, I pulled up one of our favorite contrarian indicators, the Wall Street Journal, to see what they were recommending. It's said that bull markets often climb a "wall of worry", so my thinking was that if they displayed a "run for the hills" sentiment, that may indicate that this is just a correction on the way up.

Much to my delight (because I'm short the markets, as you see below), the article I pulled up from the front page expressed optimism that this pullback represents a nice buying opportunity.

Even some of the optimists think it would make sense for stocks to fall as much as 10% before they resume their gains.

The bullish tone and level of confidence being exhibited by investors is truly awe inspiring, given that most investors lost 40% of their porfolios in the previous crash. That says to me that this bear market rally has completed it's mission, and we should prepare for the next leg down.


Positions Update - Long the Buck, and Now Short the S&P

At last - a positive week for the dollar! And no coincidence that, meanwhile, stocks got slaughtered. A sign of things to come? I think so!

On Thursday, I shorted the S&P, thus far successfully. I think over the coming months, you may be able to short just about anything and do pretty well. Long the dollar, short everything else - that's my recommendation until further notice.

The dollar - gearing up for another megarally?
(Source: Barchart.com)

Open positions:


Thanks for reading!

Current Account Value: $25,969.68

Cashed out: $20,000.00
Total value: $45,969.68
Weekly return: 8.8%
2009 YTD return: -48.9%

Prior yearly returns:
2008: -8%
2007: 175%
2006: 60%
2005: 805%

Initial trading stake: $2,000.00

Most Popular Articles This Month