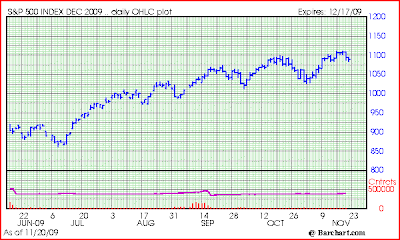
The story of the investing week was the lack of confirmation of the new Dow and S&P highs by the secondary indices. Stock market tops often occur when sectors "peel away" from the up trend one by one, as fewer and fewer asset classes make new highs.
While this is no guarantee of a top, the odds certainly appear to favor a downturn more now than they have at any point since the March lows.
Steve Hochberg of Elliott Wave International was interviewed on the Financial Sense Newshour last Thursday - if you're into technical analysis and indicators, I'd definitely recommend a listen. I read Steve's market updates every Monday, Wednesday, and Friday - this interview will give you a good idea of what he's seeing.
What Markets are Peeling Away?
A lot of the junk that led this bear market bounce is starting to rollover. The poster child may be the banks - for example, the KBW Bank ETF (Ticker: KBE) still sits below its March lows:
Bank stocks rolling over again?
(Chart source: Google Finance)
And what about our favorite leading indicator, the Chinese stock market? Here the bulls may have some hope, as the Shanghai Composite Index looks to be making another run at new 2009 high.
China takes another run at its 2009 highs.
(Source: Yahoo Finance)
The final month of the year should be quite revealing - if the Shanghai Composite does not take out these highs, and instead puts in a "lower high" before turning lower, then it could be "look out below!"
Isn't Gold Signaling That Inflation is Here?
Gold at $1150, ironically, seems to be the "surest one way bet" in the market. I say ironically, because when gold was plunging last year below $800 and even $700, all the news and speculation seemed to be that there was no end to the drop in sight.
Now with gold going up seemingly everyday, there is now a "floor of $1000" below the price of gold, with a host of "fundamental" reasons being cited, such as China instructing its citizens to load up on bullion.
Also the falling dollar is being credited as a reason why gold is destined for $2000 or higher. That may be the case eventually, but for right now, the dollar appears to be bottoming (see chart below). When unrelenting bad news no longer pushes an asset down in price, it's probably set to rally, and that's what we're looking for out of the dollar in the near term.
The most interesting, and potentially damning, thing to me is the fact that, despite gold's spot price sitting over $100 higher from it's previous high in 2008, gold stocks are still below their previous 2008 highs.
Despite all the enthusiasm for gold's prospects, gold stocks have not (yet) taken out their 2008 highs. (Source: Yahoo Finance)
For the record, I do expect gold, and gold stocks, to go higher - eventually. But I think we're in for a huge deflationary wash out before that happens. We shall see, but this popular trade just seems way too obvious, and loved, right now.
Still "All the Same Markets"
It's worth noting that we still haven't seen any markets "decouple". Either everything rallies, and the dollar tanks, or the dollar rallies and everything else tanks. Until further notice, I still believe diversification is a waste of time.
For some background on the "all the same markets" theory, here's a post from earlier in the week.
Positions Update - Really Short the S&P, Long the Dollar
As if I wasn't already massively short the S&P, I also picked up a couple of cheap puts on the S&P at 1050. These puts are slightly profitable, while the futures positions continue to show a loss.
Going forward, I may look to buy more "out of the money" puts on the S&P, as I expect it to be heading to much lower levels.
The dollar still searches for a bottom.
(Source: Barchart.com)
Thanks for reading!
Current Account Value: $20,266.95
Cashed out: $20,000.00
Total value: $40,266.95
2009 Returns: Ugh, sick of calculating, too depressing!
Prior yearly returns:
2008: -8%
2007: 175%
2006: 60%
2005: 805%
Initial trading stake: $2,000
Total value: $40,266.95
2009 Returns: Ugh, sick of calculating, too depressing!
Prior yearly returns:
2008: -8%
2007: 175%
2006: 60%
2005: 805%
Initial trading stake: $2,000


No comments:
Post a Comment