Showing posts with label debt deflation. Show all posts

Monday, April 12, 2010

Why Inflation is Dead: Two Revealing Charts of Consumer Credit Trends

Late last week, our good friend and fellow deflationist Carson sent over a link from Mish Shedlock's blog, reporting a sharp annualized decrease in consumer and revolving credit.

I just plotted the Fed's historical data since 1978 (which I chose because there was a single quarter anomaly in 1977 that I didn't feel like dealing with).

First, we see that consumer credit, as of February 2010, is decreasing at an annual rate of 5.5%:

Consumer credit, after trending positive YOY in January, is once again heading south.

Next we look at revolving credit, where the data is even uglier, both in current and historical terms. Revolving credit decreased at an annual rate of 13%:

Will this debt ever be paid off?

The sharp decline in revolving credit, which is defined as credit that does not have a fixed number of payments or payment schedule (think credit cards), would appear to support the debt deflation argument (of Robert Prechter, most notably) that much of the current debt outstanding is going to go unpaid.

So while the government has engaged in quantitative easing to "ease" the issuing of its own debt, it has not yet offered to print up some greenbacks to pay off the debt of American citizens.

Thus far, it appears Americans are still choking on their massive loads of accumulated debt, unwilling to take on more credit, no matter what the Fed does.

It will be interesting to see if the Fed is able to reverse these trends.

Wednesday, April 07, 2010

The Hidden, Historic Bubble That Could Burst Any Day

Of course we're talking about...

...all at once now...

Muni bonds!

Yay! Of course, municipalities far and wide have no way to pay back their increasing deficits amidst falling tax revenues.

Of course you knew this already, being an astute reader and no doubt a contrarian thinker. But the mainstream press is even starting to catch on.


Declining income from property, sales and other taxes coupled with growing pension obligation debts and the residual effects of the financial meltdown are inflating a dangerous bubble in the $3 trillion to $4 trillion public bond financing market.

If the bubble bursts, agencies will be unable to borrow, and would cancel or postpone public projects such as school construction or building roads and highways. At worst, governments could default and upend the historically safe municipal bond market.

"This is the most serious municipal debt crisis in U.S. history, including the Depression," said Denver-based attorney Jeff Cohen, who represents bond issuers and buyers. "Arizona has huge problems. So do Nevada, Illinois, New York and New Jersey. And California has the same credit rating as Kazakhstan."

Small to mid-size public agencies, in particular, have been hit hard, said Cathy Spain, director of the Center for Enterprise Programs at the National League of Cities.

Not only has public agencies' income dwindled, but they can't even buy the bond insurance that would lower their borrowing costs. Most of the bond insurance companies, who participated in the mortgage-backed securities shenanigans, spiraled out of business during the bank meltdown
.

Get your popcorn ready - this should be a doozy!

Also check out Robert Prechter's thoughts on why you should run, not walk, from these "safe" muni bonds.

Wednesday, March 24, 2010

Bill Gross' Take on Portugal's Downgrade and Escaping the Sovereign Debt Trap

Ever wonder what the hell takes the rating agencies so long?

Today, leading credit agency Fitch downgraded Portugal's debt amid "growing concerns about the government's ability to service it's borrowings."

Well - duh - increased borrowings coupled with decreasing tax revenues should raise concerns. What amazes me is that the Euro traded down today on the news - this shouldn't have been news at all, everybody saw this coming from Portugal as soon as Greece got the hiccups.

If the tax revenues were coming back, there might be hope - but revenues are not coming back anytime soon, so hope is bleak, if not non-existent. Europe is an economic basketcase with declining demographics - it's completely toast.

Bond king Bill Gross of Pimco weighed in today - in his eyes, there are three factors which could, at least theoretically, allow a country to escape the sovereign debt trap:
  • It must be able to print its own widely accepted currency
  • Have manageable budget deficits, and
  • Find investors willing to buy their bonds (Source: Forbes)
The US, for now at least, passes all 3 tests...Greece, Portugal, and the rest of the PIGS obviously do not. Much of the rest of the world does not either.

Is sovereign debt the next domino to tumble in the global financial crisis? It sure looks like things are teetering.

To put it in perspective how bad things are when the US looks good in comparison, check out Bud Conrad's excellent analysis about America's federal deficit (Hint: it's even worse than you think!)

Friday, January 22, 2010

Inflation and Deflation - What to Consider, and What Indicates We're Wrong?

Stumped about the inflation/deflation debate? Good news - you're not alone!

Hard Asset Investor's Brad Zigler is also somewhat undecided on the subject. Though he leans toward inflation, he acknowledges that very strong deflationary forces are also in play.

Though you know that I'm one of the lonely souls in the deflationary camp (along with many readers!), I also am not 100% sure of which way things are going to unfold.

But that's OK - that's why we follow the trend! Ultimately, the market will be the final arbiter of this debate, and there's nothing we can argue today that will change what the market is going to do.

So, grab your position, but by all means, be flexible and ready to change if we're proven wrong. Personally, I'm watching the stock market, and the dollar...especially the dollar. If it takes out it's old lows, that would indicate a serious flaw in our dollar rally/stock tanking scenario.

That looks unlikely right now, though, as the dollar looks to be at the start of a major rally.

Monday, January 18, 2010

This Chart Says It All - US Household Continues Deleveraging at Record Pace

US households continue to shed debt at a record pace - this graph says it all...

US households are finally "just saying no" to debt.

To put this breakdown in perspective - the Fed's data on this goes back to 1976, and household debt grew every single year until 2009.

In fact, we're looking at two straight years of deleveraging in terms of both mortgage debt and consumer credit - another record.

Yikes!

Hat tip to friend and reader Carson for the tip on this data.

Sunday, January 10, 2010

Tax Receipts Down, Government Jobs Up...This Won't End Well

Bernanke - man of
the year. Did he earn it? Or
pushing on a string?

Markets Strong Out of the Gates...But How Much Conviction is Left?

The broader indices continued to climb higher in the first week of trading in 2010. But how much buying power is behind these moves?

Moves straight up usually don't end well.
(Source: Barchart.com)

Since the correct in early November, stocks have climbed just about everyday, without much of a blip of a correction. Meanwhile, upward momentum and volume continue to look anemic, indicating that the rally may finally be running out of gas.

But thus far, warnings of a potential turndown have either been early, or wrong. So which is it?

While I am not a huge chartist in terms of reading into patterns (head and shoulders, etc), I do notice that the chart of the S&P above is tracing out an ascending, contracting triangle. These are usually proceeded by sharp moves either up or down. Obviously a move down would appear to be the more likely scenario, so it will be interesting to see what the S&P does over the next couple of weeks.

It very well could continue to move higher, so I am going to hold off on shorting until we see a definite break in the uptrend. The mistake I make in early November was shorting too early, under the (incorrect) assumption that the uptrend HAD been broken.

So we'll chalk that up to a learning experience, and try to be a little more patient on pulling the trigger.


Tax Receipts Continue to Decline

It's hard to get excited about this "economic turnaround" when tax receipts continue to fall across the board. Tax receipts may be the least manipulated of all economic stats, so are worth paying attention to.

Here's a smattering of tax receipt data from around the nation...and little to none of it is positive. For a fun exercise, type "tax receipts" into Google News, and see what comes up!
It seems that a lot of the "news" about the economy bottoming is nothing more than pundits projecting the bounces in the DOW and the S&P onto Main Street. In reality, that hasn't happen.

The markets have bounced since last March because that's what markets do. They never travel up or down in straight lines. All we've done thus far is mirrored 1930's stock market retracement - nothing more, nothing less.

From a technical standpoint - wake us up when we've surpassed the usual Fibonacci retracement levels.

From a fundamental standpoint - wake us up when tax receipts start to turn around...because we know there's only one reason for people to pay more taxes, and that's because they are making more money!

Now as to the ethics of taxation in the first place...we'll leave that libertarian rant for another day.


Evans-Pritchard Sees Japanese Hyperinflation

If you think this column is a ball of sunshine, you'll love Ambrose Evans-Pritchard's take on the 2010 financial markets:

The contraction of M3 money in the US and Europe over the last six months will slowly puncture economic recovery as 2010 unfolds, with the time-honoured lag of a year or so. Ben Bernanke will be caught off guard, just as he was in mid-2008 when the Fed drove straight through a red warning light with talk of imminent rate rises – the final error that triggered the implosion of Lehman, AIG, and the Western banking system.

As the great bear rally of 2009 runs into the greater Chinese Wall of excess global capacity, it will become clear that we are in the grip of a 21st Century Depression – more akin to Japan's Lost Decade than the 1840s or 1930s, but nothing like the normal cycles of the post-War era. The surplus regions (China, Japan, Germania, Gulf ) have not increased demand enough to compensate for belt-tightening in the deficit bloc (Anglo-sphere, Club Med, East Europe), and fiscal adrenalin is already fading in Europe. The vast East-West imbalances that caused the credit crisis are no better a year later, and perhaps worse. Household debt as a share of GDP sits near record levels in two-fifths of the world economy. Our long purge has barely begun. That is the elephant in the global tent.

As if this wasn't enough, he also sees quantitative easing in Japan as finally getting "over the hump" in terms of deflation, and achieving what so far has been an elusive goal - hyperinflation!

Finally, Evans-Pritchard also pokes some good fun at Europe's economic prospects.


The Worst Trend of Them All

Take a look at this chart of public vs. private sector employment, and tell me this chart isn't the most damning of them all!

This is the type of "breakout", or rather "breakdown", that you short 100 times out of 100.

(Hat tip to friend and fellow Austrian economic believer Carson for sharing this link).


Diversifying Your Life

Earlier this week, our local Casey Research "phyle" met up to discuss our usual cheery topics, including what to do if the US completely melts down.

Doug Casey recommends having your whole self diversified - ie. citizenship in one country, your business in another, real estate in a third, and even some savings in a forth. So, if it really hits the fan in your homeland, you're not completely screwed!

So our group chatted about the logistics of moving savings, including bullion itself, abroad. If you are interested in pursuing these types of options, here's a good interview conducted by the "Sovereign Man" Simon Black about storing gold in Panama.

Gold storage in Panama is a hot item. Banks have long waiting lists for safety deposit boxes, and as I’ve discussed before, many Panamanian banks are even starting to eliminate this service, reducing the available supply of boxes on the market.

Personally if I had meaningful investment capital, I'd probably be inclined to get some bullion stashed in another country...just in case. But as is, I've got most of my hopes, dreams, and prospects tied up in our small time tracking software company.


What it Means to "Turn Japanese" Economically

Stratfor, a "personal CIA" service of sorts, released some engaging forecasts for regions around the world in 2010. Here's Stratfor CEO George Friedman discussing Japan's economic outlook:


I find his take on Japan very interesting. If the US is indeed "turning Japanese" economically, you would expect to see an increased emphasis on full employment, rather than return on capital, for the economy.

While I'm sure our politicians have the same DNA as their Japanese counterparts, I'm not yet convinced that American citizens do. Are the characteristics Friedman identifies cultural? Or, will we see Americans follow in the footsteps of their Eastern counterparts?

The next couple of elections in this country should be VERY interesting, as we'll see how asleep the citizens of this nation really are. I'm not yet sure if the tea parties and "libertarian roots" are the tip of a larger iceberg, or one-off types of events.


Trading Positions - Looking for Dollar Re-Entry

My January S&P puts are going to expire worthless - as mentioned earlier, I jumped into that trade too early.

I am looking for a re-entry point into a long US dollar position, and I'll probably look at picking up some UUP for my equity accounts as well. I think we'll see a further pullback in the dollar here, before it resumes it's march above it's previous highs from 2008-09.

We've got small, but top notch, company in the short-term long dollar trade. First we saw our hero, Jim Rogers, take a short term position in the buck. And earlier this week, Tom Dyson wrote that a major uptrend is just getting started in this hated asset.

The buck, everyone's least favorite asset, quietly bottomed in November.
(Source: Barchart.com)

Another way of playing the dollar rally would be to short currencies primed for a fall, such as the Euro or the Australian dollar. Both have started to turn down sharply.

Have a great week in the markets! Comments are always welcome and very much appreciated.

Wednesday, December 02, 2009

Why the Worst Case Conclusions are Already "Priced Into" the Market

Tom Dyson, one of my favorite investment writers/analysts, is also one of the very few lone soles left in the debt deflation / dollar bull camp (last one out, please turn out the lights!)

Last week, Tom penned an article that I thought articulated the case for a near term dollar rally brilliantly - and our good friends at Stansberry & Associates were kind enough to allow us to reprint the piece in it's entirety here.

So enjoy Tom's bet with his boss (who's another great investor BTW). And if you're interested in subscribing to Tom Dyson's premium service, The 12% Letter, we've arranged for readers here to receive a 6-Month Risk-Free Trial (click here to learn more).

***

Porter Stansberry Is My Patsy
By Tom Dyson

On Friday, I made a bet with my boss...

Porter Stansberry is my boss and a good friend. He's one of my favorite investment analysts in the world. An investor who is not reading his monthly newsletter is flying blind in a rainstorm.

But I have a disagreement with him right now. Porter says the United States government is broke. He says there's no way it'll be able to borrow enough money over the next 12 months to cover its obligations. There's going to be an enormous government cash crunch unless it "prints" the money.

By printing this money, the government is forcing our foreign creditors to make an impossible choice: Stay with the dollar and see 50% or more of your intrinsic value wiped out... or abandon the dollar completely and risk a global crisis.

Whatever happens, Porter says, gold soars hundreds of percent, the dollar spirals toward zero, and the price of government debt erodes.

Last week, I bet Porter he's wrong.

Specifically, I bet him the interest rate on the 10-year Treasury note would be below 4% at this time next year. The interest rate on the 10-year Treasury note is the price the United States government must pay to borrow money over 10 years. If the market thinks the government is broke and can't afford its debt, this interest rate will rise. Porter bet it'll rise above 4% in the next 12 months. I bet it will not.

Look at this chart of the dollar in terms of the Swiss franc. The Swiss franc is the most stable paper currency in the world. As you can see, the dollar has been falling against the Swiss franc for more than 40 years. That's Porter's big trend... and it's down.


But notice the long periods where the dollar rises... despite the big trend. There was a huge bull market from 1979 to 1985, for example, and another one from 1995 to 2001.

That's the thing about markets. They never move in straight lines. They overshoot in one direction and then overshoot on the way back. And the funny thing is, just at the moment when they are most stretched in one direction, investors feel the strongest desire to join the crowd.

Take 1979 as an example. It seemed as if the dollar was about to plummet. There were incredibly compelling arguments for selling the dollar and buying hard assets... as there are today. It just wasn't a good time for selling the dollar.

I actually agree with Porter's conclusions. I just think much of the worst-case conclusions have been "priced into" the market. The financial headlines are full of stories about gold and the dollar... billionaire John Paulson buying gold... the great money manager David Einhorn buying gold... India buying gold... Chinese housewives buying gold... Warren Buffett protecting himself against inflation.

It's a popular thing to do nowadays... nothing like in the early stages of the gold bull market in 2002.

The dollar's already been in a bear market for almost 10 years, and Porter's theory has as much traction as it did in 1979. It's an incredibly compelling argument... but my gut tells me if you bet on inflation now, you're walking into an ambush.

Now just isn't the right time to be placing bets on the end of the dollar. It's the easy trade that feels right. Any great trader will tell you the "hard trade" is always the right trade.

Unless you're a short-term trader or you still don't own any gold bullion, I recommend you avoid making any new investments based on inflation or the dollar's destruction. You'll make far more money on this sort of investment when the dollar is nearing the end of a multiyear bull market... like it was in 2000.

Again... this is a matter of timing. I'm still a gold bull. I still think people should keep 5%-10% of their assets in gold, for wealth insurance... for a way to own "real money."

But I'm making the "hard bet" that interest rates will not soar in the next year. I'm making the hard bet that the dollar with strengthen. And I'm not afraid to hold cash. It's going to grow in value over the next year. And I'm going to enjoy collecting more of it from my patsy, Porter Stansberry.

Ed. Note: Tom Dyson is the author of The 12% Letter, one of my top 5 favorite investment newsletters. To sign up for a risk-free trial, click here.

Sunday, October 25, 2009

Three Sanity Checks at this Key Inflation-Deflation Inflection Point

I think we're at a key inflection point in the financial markets at this juncture. The direction that things head next could decide the winner, at least for the next few years, of the inflation vs. deflation battle.

So I spent the morning revisiting and rereading many of my favorite arguments from both sides of the debate, and came up with three key metrics for us to revisit.

First, let me lay a little groundwork and list my preexisting assumptions:
  • My timeframe is defined as the next 3 years. After that, we may well see hyperinflation and/or a true crash in the dollar - but for the sake of this argument, I want to look at the next 3 years only (reason being, if you misplay the next 3 years, you could be toast anyway!)
  • I accept the Fed's ability to "print" money.
  • I also believe that inflation is preferable to the government, and given the choice between inflation and deflation, they will inflate (or at least attempt to) every time. Also, massive government deficits certainly make inflation all the more tempting.
When revisiting my favorite arguments for both sides, I noticed that three central themes were the focus of much of the debate:
  1. Inflation will occur when the banks start lending again.
  2. The demand for money, or prevailing social mood, will determine if consumers trade in their cash for anything (leading to inflation), or if they hoard their cash to pay down debt (leading to debt deflation.)
  3. Stock prices will reflect a goosing of the money supply.

Checkpoint 1: Inflation requires an increase in bank lending

Thanks to the wonders of our fractional reserve banking system, where banks are only required to have a fraction of the money they lend out, bank lending has a tremendous multiplier effect on the money supply. During times of expanding credit (2002 - 2007 most recently), this effect was felt in full force, as loose credit led to a bubble in nearly all asset markets.

Since the credit crisis began, banks have significantly curtailed their lending. While the Federal government has boosted the balance sheets of the big banks, there has not been a proportionate growth in loans (see chart below).


Herein lies the rub - bank lending has not picked up, at least yet. Check out the graph below, courtesy of the St. Louis Fed:


Conclusion: As long as bank lending continues to decline, it's difficult to make an argument for inflation. However, if and when this chart begins ticking up once again, that will be a strong indicator that inflation may be on the way.

Checkpoint 2: The demand for money and prevailing social mood

From World War II until 2007, the world was a place of expanding credit. This growth was driven by consumer demand for credit, which was particularly strong in the US. That is the key point - that the growth was driven by from the demand side, which in turn, resulted in increasing supply.

While many blame Alan Greenspan for creating a housing bubble this decade with artificially low interest rates, it's important to consider the role that consumers played in that spectacle. Greenspan was only giving the populace what it wanted - more credit. He may have spiked the punch bowl, but only at the insistence of the drunken party goers!

Today, with mortgage rates still near historic lows, we have no housing bubble any longer. In fact, we have a plummeting housing market. Why?

Because there's no demand for credit. Consumers are choking on debt - they are screaming "No Mas!"

Can the Fed inflate the asset markets one more time? They are trying like hell, but they'll only be successful if the social mood in the United States permits it.

One of the major reasons Japan was never able to reignite another bubble after 1989 is that the mood of consumers permanently shifted. The demand for money increased - consumers wanted to hoard it. They did not want to speculate, or trade it in for assets.

Did the social mood of the US permanently change in 2007?

One tea leaf worth paying attention to is the demographics card. By 2007, the US had some noteworthy demographic parallels with Japan of 1989 (ie. we're getting old). Though we are not "as screwed" as Japan in terms of demographics, thanks to immigration and somewhat higher birth rates, we've peaked demographically as a country, at least until further notice.

Conclusion: Demand for money, and social mood, are admittedly challenging to measure in an objective manner. There may have been a permanent shift in 2007 - if so, the Fed may find that, like Japan, it's "pushing on a string" in terms of trying to change consumer behavior and attitudes towards debt.

Checkpoint 3: Monetary goosing will show up in stocks, especially financials, first

According to Milton Friedman, the script for inflation roughly goes like this:
  1. Increase the money supply
  2. The new money goes into stocks first, increasing stock prices
  3. Then economic activity increases (a false boom)
  4. Then the Consumer Price Index (CPI) rises
Sure appears like the script is playing out to a tee. With regards to stocks, we've seen that financial stocks have been the strongest performers, which you'd probably expect in an inflationary boomlet.

But - this market rally has, thus far, only qualified itself as a stellar bear market bounce. We are still in typical retracement territory. Bounces usually retrace roughly half of their losses - often even more. The 2009 bounce is currently eerily similar to the 1930 bounce in terms of magnitude.

Conclusion: The jury is still out on what has actually driven this stock market rally. We could be at an important inflection point. If the market continues to head higher, the case that it's being driven by inflation will strengthen. If it makes new highs, that would probably seal it.

On the flip side, if the market turns down from here, then all we saw this summer and autumn was a classic bear market bounce.

Bottom Line: The coming months will be very interesting, and hopefully quite insightful, in terms of illuminating which side is winning the inflation/deflation battle. It's too close to call just yet in my opinion, as both scripts have been fulfilled thus far. But we could be near a fork in the road!

Some More Good Reading

Positions Update - Still Long the Buck

It looks like the broader markets may, at last, be rolling over. Which should be bullish for the buck.

The dollar - gearing up for another megarally?
(Source: Barchart.com)

Open positions:


Thanks for reading!

Current Account Value: $23,859.83

Cashed out: $20,000.00
Total value: $43,859.83
Weekly return: -1.9%
2009 YTD return: -53%

Prior yearly returns:
2008: -8%
2007: 175%
2006: 60%
2005: 805%

Initial trading stake: $2,000.00

Monday, October 12, 2009

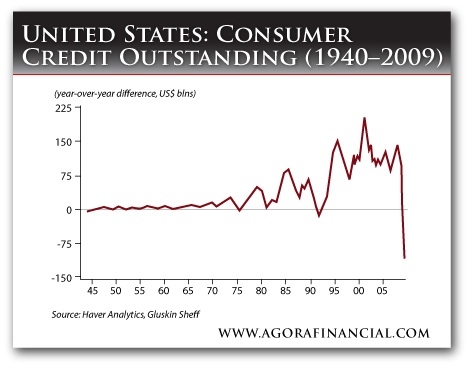
Scary Chart of US Consumer Credit...Yikes!

To say that consumer credit is contracting in the United States may be a bit of an understatement!

Can you spot the trend in consumer credit?

Contracting credit is the crux of Robert Prechter's deflationary thesis - something we've been discussing at length in this space.

How about another haiku to summarize?

Credit's going poof
As gold rockets through the roof
Did I miss something?

This chart
was originally published in the Daily Reckoning. The Daily Reckoning, a FREE daily e-letter, offers a "uniquely refreshing" perspective on the global economy, investing, and today's markets.

Wednesday, September 16, 2009

US Credit Still Shrinking at "Great Depression Rate"

So is the money supply increasing, or not? Ambrose Evans-Pritchard of the Telegraph writes that US credit is shrinking big time - at it's fastest rate since...drumroll...the 1930's.

Professor Tim Congdon from International Monetary Research said US bank loans have fallen at an annual pace of almost 14% in the three months to August (from $7,147bn to $6,886bn).

"There has been nothing like this in the USA since the 1930s," he said. "The rapid destruction of money balances is madness."

The M3 "broad" money supply, watched as an early warning signal for the economy a year or so later, has been falling at a 5pc annual rate.


I can't say for certain whether inflation or deflation will prevail - though I do believe that caution is warranted before hopping on the inflation train whole hog. There are a lot of wrinkles to this unfolding saga, no doubt.

Related reading:

Monday, August 10, 2009

Get Ready for 19 Years of On/Off Deflation If History Rhymes

We keep hearing how US households are paying off their debts. The important question is - how much debt is left to be paid off?

For some insights into how much painful deleveraging may be left - I'd like to share what Bill Bonner wrote in today's Daily Reckoning (an excellent free email newsletter by the way):

***

Harvard professor Ken Rogoff says it will take 6-8 years for households to reduce their debts to a more sustainable level. Let's see. We reported on Friday that the big upswing in credit over the last 60 years added about $35 trillion in excess debt to the system. But not all of that is private debt.

Taking the period of the bubble years, in 2000 total debt in the United States came to $26 trillion. Now, it's twice that amount - $52 trillion, of which $38 trillion is private...or more than two and-a- half times GDP. At this level, the private debt absorbs roughly one out of every seven dollars in consumer earnings - in interest and principal payments.

If the private sector undertook to reduce debt back to 2000 levels, it would mean eliminating all the debt accumulated during the bubble years - or about $19 trillion. How long will it take to pay down, write off, inflate away and otherwise shuck $19 trillion? Well, inflation is running below zero - so that is not now a source of debt reduction.

Between write-offs and pay-downs, about $2 trillion has already been cut - over, very roughly, the last 2 years. At least the math is easy.

At that rate, it will take 19 years.

Now, let's go back and look at the Japanese. How long have they been deleveraging? Gosh all mighty...19 years. From 1990 to 2009.

***

For more on deflationary possibilities, here's a case study we did last week on debt deflation.

Tuesday, August 04, 2009

Debt Deflation Case Study: The Bail Bond Industry

Here's another "on the ground" economy exclusive for you - earlier this week, I was having a friendly chat about the economy with our neighbor who sells bail bonds.

Talk about insight into what's going on in the world of Joe Sixpack - with an ironic twist that these are the families of folks who robbed Joe!

On the surface, most folks believe the bail bond industry to be absolutely recession-proof, perhaps even counter-cyclical...but that's not the case.

Credit is tight, tight, tight my neighbor says, and it's completely affecting the way he does business. Even a year or so ago, people would be able to pony up $5K for a bond, he says. Of course they'd advance it against their credit card, or take equity out of their home, etc - but they would come up with the money.

These days, that's out of the question. If he quotes anywhere near that amount, they are on the phone calling a competitor. So in the current environment, he needs to lower the initial "down payment" considerably - basically to cover his own costs - and hope that they pay the remainder in installments out of good faith.

As these are not exactly "creditworthy" borrowers, there is considerable risk to this approach, which means a lot of bad debts must be written off (and then it drifts away to "money heaven").

The bottom line, dear reader, is that this is debt deflation. While Ben Bernanke is indeed running the printing presses at full speed, credit has not (yet?) trickled down from the pockets of Goldman Sachs and Co down to the average slob.

Thus, you're seeing an "inflationary boomlet" in asset prices - stocks, oil, etc - that is not (at least yet) being reflected in basic goods and services.

Now Marc Faber recently commented that he's surprised prices have not dropped MORE during this time of economic turmoil - an interesting point which we'll keep an eye on...

So stay tuned to this space for more inflaton/deflation updates, straight from the trenches!

Friday, July 31, 2009

Weak Treasury Sales...Bond Vigilantes Rolling Into Town?

Anyone want to puchase debt at an artificially low interest rate from a party that's highly unlikely to be able to pay you back? Anyone?

Surprisingly...you're not alone! The Treasury auctioned off another $39 billion last Wednesday (it's crazy that we get immune to seeing these huge numbers) in an auction that "drew poor demand."

It really looks like the government will have to monetize a lot of debt (as previously laid out in an excellent guest article we ran a few months ago - link below).

Heavy monetization usually leads to inflation. Problem is, the inflation/hyperinflation call appears to be the most obvious one on the planet right now. And the obvious call is often not what plays out in the world of investing.

So can the Fed inflate its way out of this? Or is Robert Prechter correct that you can't beat deflation in a credit based system?

Further reading on this topic:

Monday, July 27, 2009

Hyperinflation? Not in Airline Tickets

Even with oil north of $60, airline tickets are incredibly cheap right now. This latest example of price deflation just popped into my Inbox, courtesy of Jet Blue:


Tuesday, July 21, 2009

When Will Debt Deflation Turn Into Hyperinflation?

We know that, right now, we are most likely in a period of "debt deflation." Wages are falling. Prices also appear to be falling - though this is open for debate, as there are smart people who believe prices are steady or even rising. For example, Marc Faber recently said he's surprised that prices are not falling faster during this downturn, which may be an ominous sign for inflation.

But for the sake of argument, let's say that at this moment in time, we are experiencing debt deflation. When, then, will the printing of money create price inflation? Tomorrow? Next month? Next year?

I read a great explanation today in Agora's 5 Minute Forecast, where they quote guru Rob Parenteau:

When it comes to the fate of the U.S. dollar, “Two tsunami waves are crashing in to one another,” Rob Parenteau told us last night, “debt deflation on one side, and policy inflation on the other.” Rob delivered quite a speech at our first ever meeting of the Richebacher Society, amid the spectacular views of the hotel’s rooftop lounge. Our highlight came during a period of open dialogue between Rob and Riche Society members when he was asked how will we know when deflationary period is over and inflation -- or hyperinflation -- begins?

The answer, said Mr. Parenteau, is found in credit and wages. No matter how inflationary the government may be, true hyperinflation can’t be had until the consumer has access to excessive credit and his wages rise as the value of money falls. In the current environment, where credit is tight and wages are falling, rapid inflation would only be possible if there were a true crisis of confidence in the dollar. If that were to happen, he assured us, it’d be pretty obvious.

So while the current deflationary environment exists, what do we do with our money? Here's a guest article from Mr. Deflation himself, Robert Prechter, who shares 10 Things You Should and Should Not Do During Deflation.

And if you're looking for more ideas, Tom Dyson has a few as well. Tom writes the 12% Letter, an excellent publication that digs out high income ideas. Yesterday in DailyWealth, Tom had this to say about deflation:

Airline fares are also down. I just bought a nonstop ticket from Florida to Las Vegas for $120 on Southwest. This peak summer-season ticket probably would have cost twice that much last year.

Local retailers are offering big discounts, too. Last weekend, I saw three retailers advertising liquidation sales with entire store discounts of at least 50%.

Even Internet retailers are using heavy discounts. I bought some bicycle equipment online last week. I got a 40% discount on the retail price... then another 20% discount as part of a Fourth of July sale.

The Federal Reserve may be inflating our currency, but when it comes to the prices of the goods and services I use, I only see deflation.

Cheap credit is the cause. Credit's been too cheap – on and off – for the last three decades. Cheap credit caused savers to spend more than normal and entrepreneurs and businesses to borrow and build more than normal. It led to overinvestment in production and service capacity.

Last year, we reached the peak of the credit and price boom... and now prices are falling. We're in what economists call a "debt deflation."


To read Tom's full article, click here - and I'd also recommend you check out the 12% Letter if you enjoy his insights.

Most Popular Articles This Month