Sunday, November 29, 2009

Dubai's Meltdown; Liquidity Flows Make the Markets; S&P Fair Value

Dubai's Meltdown

The Thanksgiving holiday is traditionally a very slow time for the markets...not so this year! Dubai rocked the financial world with its announcement to debtors that it needed a bit more time to make good on outstanding debt payments.

Uh oh - here we go again?

Global markets reacted quite violently to the news, throwing up with the vigor of a hungover Wet Wednesday reveler. The real news here is not Dubai in and of itself - a debt bender from a pretty small country can't do that much damage alone to the global financial system. But, if this is a harbinger of more sovereign defaults to come, then now may be the time to beat the Holiday investor crowd and check into the debt rehab clinic!

Is fear back in the markets? It's been a bear market in fear since the March lows - perhaps it's time for fear to bounce back. This week will sure be interesting.

What happens if fear bounces back? We've seen this playbook before, as Mr. Market has already given us a sneak preview...

All Markets are Driven by Liquidity Flows

Friday was a classic fear driven day lately, with the dollar rallying, and everything else dropping. This is the "All The Same Markets" theory we've been following closely for most of 2009, originally popularized by one of our favorite gurus, Robert Prechter.

Most people see that the asset markets are interconnected - it's the old reflation/deflation trade. But, why does the dollar move counter to all of these other markets?

The "flight to safety" explanation is a popular one, and I personally think it's as wrong as it is popular.

The reason the dollar rallies is not because it's perceived a safe currency, but paradoxically because it's the sickest one. The reason is that most of the debt in the world is denominated in US dollars. When that debt goes "poof" - that is, the borrower defaults, and the money that once was there ascends up to money heaven - the supply of money goes down.

When liquidity tightens, this debt can go "poof" in a hurry, as we saw during the last leg down of the stock market. This is highly deflationary. And, because most of this debt is denominated in dollars, the supply of US dollars drops, and the value of each remaining dollar goes up.

But Can't the Fed Print Money and Reflate?

Yes, but there are limits to what the Fed can do, at least in the short term. Even an expert money printer like Ben Bernanke has constraints - he's only human, after all.

When you consider the sum of outstanding credit is somewhere in the neighborhood of $50 to $100 trillion (give or take a trillion or ten), it makes the money the Fed has printed so far (a trillion or two) pale in comparison.

Can the Fed inflate eventually? Sure - but probably only after all of this bad debt has been destroyed. This could take a few years, and there will be some wicked asset deflation in the meantime.

(For further reading, check out Terry Coxon's article: When Will Inflation Really Hit Us?)

First Dubai, Then Greece?

Greece is warming up in the on deck circle, as it tests the levels of sovereign debt, writes Ambrose Evans-Pritchard for the Financial Times.

Evans-Pritchard reports that Greece is "disturbingly close to a debt compound spiral," - and the bond vigilantes appear to be circling the wagons.

S&P Fair Value: Lower Than Current Levels

My good friend, regular reader, and private wealth manager Jonathan Lederer put out an excellent quarterly update for his clients last week, in which he analyzed the valuation for the S&P 500.

Jonathan is a very sharp value investor who has the patience and insight to perform excellent valuation analysis on equities. I always benefit greatly from absorbing his research, which is often a great counterbalance to my views.

He's been kind enough to allow me to share his presentation with my readers, which you can view here...I would definitely recommend you spend some time to watch his quarterly update.

Spoiler alert: Jonathan concluded that the market valuations are a bit rich at current levels, which concurs with my thinking and belief that the market risk right now is to the downside.

Positions Update - Still Really Short the S&P, Long the Dollar

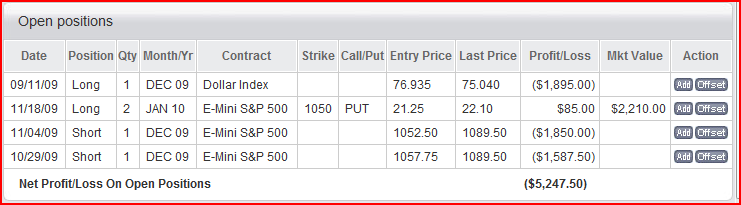
And we continue to wait for these trades to go our way...was Dubai the opening shot in the next wave of deflation? The next week should be quite interesting!
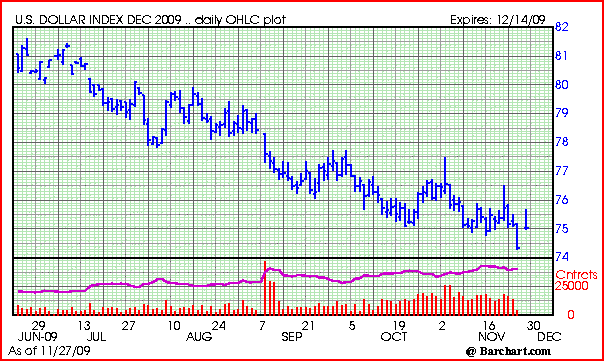

Was last week's downtick the bottom for the dollar?
(Source: Barchart.com)


The S&P rallied off it's deep lows on Friday, but still closed down big on the day.
(Source: Barchart.com)

Open positions:


Thanks for reading!

Current Account Value: $19,711.95

Cashed out: $20,000.00
Total value: $39,711.95
2009 Returns: Ugh, sick of calculating, too depressing!

Prior yearly returns:
2008: -8%
2007: 175%
2006: 60%
2005: 805%

Initial trading stake: $2,000

Sunday, November 22, 2009

More Signs the Stock Market (and Everything Else) May Finally Be Topping Out

The story of the investing week was the lack of confirmation of the new Dow and S&P highs by the secondary indices. Stock market tops often occur when sectors "peel away" from the up trend one by one, as fewer and fewer asset classes make new highs.

While this is no guarantee of a top, the odds certainly appear to favor a downturn more now than they have at any point since the March lows.

Steve Hochberg of Elliott Wave International was interviewed on the Financial Sense Newshour last Thursday - if you're into technical analysis and indicators, I'd definitely recommend a listen. I read Steve's market updates every Monday, Wednesday, and Friday - this interview will give you a good idea of what he's seeing.


What Markets are Peeling Away?

A lot of the junk that led this bear market bounce is starting to rollover. The poster child may be the banks - for example, the KBW Bank ETF (Ticker: KBE) still sits below its March lows:

Bank stocks rolling over again?
(Chart source: Google Finance)

And what about our favorite leading indicator, the Chinese stock market? Here the bulls may have some hope, as the Shanghai Composite Index looks to be making another run at new 2009 high.

China takes another run at its 2009 highs.
(Source: Yahoo Finance)

The final month of the year should be quite revealing - if the Shanghai Composite does not take out these highs, and instead puts in a "lower high" before turning lower, then it could be "look out below!"


Isn't Gold Signaling That Inflation is Here?

Gold at $1150, ironically, seems to be the "surest one way bet" in the market. I say ironically, because when gold was plunging last year below $800 and even $700, all the news and speculation seemed to be that there was no end to the drop in sight.

Now with gold going up seemingly everyday, there is now a "floor of $1000" below the price of gold, with a host of "fundamental" reasons being cited, such as China instructing its citizens to load up on bullion.

Also the falling dollar is being credited as a reason why gold is destined for $2000 or higher. That may be the case eventually, but for right now, the dollar appears to be bottoming (see chart below). When unrelenting bad news no longer pushes an asset down in price, it's probably set to rally, and that's what we're looking for out of the dollar in the near term.

The most interesting, and potentially damning, thing to me is the fact that, despite gold's spot price sitting over $100 higher from it's previous high in 2008, gold stocks are still below their previous 2008 highs.

Despite all the enthusiasm for gold's prospects, gold stocks have not (yet) taken out their 2008 highs. (Source: Yahoo Finance)

For the record, I do expect gold, and gold stocks, to go higher - eventually. But I think we're in for a huge deflationary wash out before that happens. We shall see, but this popular trade just seems way too obvious, and loved, right now.


Still "All the Same Markets"

It's worth noting that we still haven't seen any markets "decouple". Either everything rallies, and the dollar tanks, or the dollar rallies and everything else tanks. Until further notice, I still believe diversification is a waste of time.

For some background on the "all the same markets" theory, here's a post from earlier in the week.


Positions Update - Really Short the S&P, Long the Dollar

As if I wasn't already massively short the S&P, I also picked up a couple of cheap puts on the S&P at 1050. These puts are slightly profitable, while the futures positions continue to show a loss.

Going forward, I may look to buy more "out of the money" puts on the S&P, as I expect it to be heading to much lower levels.

The dollar still searches for a bottom.
(Source: Barchart.com)


Did the S&P finally put in a top early last week?
(Source: Barchart.com)

Open positions:


Thanks for reading!

Current Account Value: $20,266.95

Cashed out: $20,000.00
Total value: $40,266.95
2009 Returns: Ugh, sick of calculating, too depressing!

Prior yearly returns:
2008: -8%
2007: 175%
2006: 60%
2005: 805%

Initial trading stake: $2,000

Thursday, November 19, 2009

Still All The Same Markets - A Picture Worth a Thousand Charts

This shot says it all - the "all the same markets" hypothesis is still in play.

Why bother with diversification when all the markets move in tandem?
(Source: Barchart.com)

Hat tip to Robert Prechter, who I believe was the first to point out the increasing correlation between every asset class, as far back as 2004. He postulated that the markets were being driven by global liquidity flows:
  • When liquidity is plentiful (2004-2007), all the markets rise together, the dollar drops
  • When liquidity dries up, the dollar rallies, all markets tank (2008 - early 2009)
Since March, we've seen liquidity increasing, and the dollar dropping - still playing according to script. So I think we have to assume this relationship is still in place, until proven otherwise.

Nothing's Changed - Stocks Topping, Dollar Bottoming

Did the intermediate top in stocks occur earlier this week? We won't know for sure for many months, but it certainly COULD have been.

The rally has been running on fumes for month, yet still moving upwards despite the naysayers (such as myself), as the S&P pushed above the 1100 mark (raise your hand if you expected that when the S&P was bottoming at 667!)

Nevertheless, all good things must come to an end eventually - and while this rally has been an impressive one, it's magnitude has occurred completely within the normal confines of a bear market rally.

A couple of weeks back, we compared the 2009 rally with the 1930 stock market rally, and found a lot of similarities. Of course you can find similarities in anything if you look hard enough, but my point was that whether or not this rally was for real was still "to be determined", as thus far it's done exactly what it was supposed to - make everyone think that it was OK to get back in the waters.

Remember earlier this year when stocks were again "risky"? Not anymore! Every drop is once again a buying opportunity. Which is exactly when things get the most dangerous.

For fellow "armchair stock market technicians", The Daily Reckoning's Eric Fry cited "a very serious negative divergence" pointed out by options expert Jay Shartsis:

"The new Dow highs have not been confirmed by the widely-based Value Line (over 2300 stocks)," Shartsis points out, "and divergences between these two indices have marked important turning points in the market in past years. This divergence, in my opinion, trumps the still bullish sentiment data and calls for a stock thrashing dead ahead.

"Traders should also note that a head-and-shoulders top is building on the Value Line Index," Shartsis continues, "with the right shoulder top lower than that of the left - an extra bearish element. At the current 2,138, the Value Line is about 4% from a new high and it doesn't look like it is headed back to that level any time soon."

Source: The Daily Reckoning, a FREE daily e-letter, offers a "uniquely refreshing" perspective on the global economy, investing, and today's markets.

What's the script when stocks turn down? The market gave us a sneak preview last year - it's everything else down too, dollar up!

Now may be an interesting time to pick up some cheap put options on the S&P, especially some of the "black swan" variety, in case this downturn has some umph behind it!

Ed. Note: On Sunday we reviewed Financial Reckoning Day Fallout, the latest book by the authors of The Daily Reckoning.

Monday, November 16, 2009

Jim Rogers: Gold Will Top $2,000; Bernanke Should Resign; Buy Coffee

Our hero Jim Rogers has been back in the news quite a bit recently - here's his latest thoughts:
Even if deflation does win the day in the near term, it does seem like gold is destined for $2,000 before this secular commodity bull market is over. If you're an investor, the best thing to do is probably to continue to accumulate gold, without worrying about the price.

As a trader, though, I'd be very cautious about gold in the short term. I think we're at a key inflection point in the inflation/deflation battle, and personally I'm wary that 2010 will usher in the return of DE-flation in a big way.

Most Popular Articles This Month